Best Options Trading Platform Features Compared

Compare options trading platforms by the job you need them to do: research the underlying, evaluate a contract, simulate a position, or execute an order. A strong charting platform and a capable options broker can work together, but their features are not interchangeable.
Start with LuxAlgo’s native charts and Quant to develop a clear market thesis and test price-based rules. Use thinkorswim or tastytrade for the options-specific contract analysis and brokerage workflow discussed below. The right combination depends on your permissions, products, budget, and ability to operate the tools confidently.
Quick feature comparison
This comparison focuses on documented features reviewed in September 2026. It is not a benchmark of live execution speed or a guarantee that every feature is available in every account, region, or device interface.
| Task | LuxAlgo native platform | Schwab thinkorswim | tastytrade |
|---|---|---|---|
| Underlying-market research | Native charts, indicators, and Quant for developing rules | Charting alongside broker market data and options tools | Charting alongside options chains and positions |
| Options payoff analysis | A price-based script test does not establish an option’s payoff | Risk Profile for modeled price, time, and volatility scenarios | Curve View and analysis tools for options positions |
| Practice and historical tests | Quant strategies run on selected chart history | paperMoney for simulated trading practice | Options Backtesting for supported historical strategy tests |
| Brokerage orders | Research and chart alerts require a separately supported execution workflow | Schwab account, options approval, and applicable permissions | tastytrade account, options approval, and applicable permissions |
| Costs to compare | Plan, credits, chart limits, and required data access | Contract charges and other applicable account or transaction costs | Opening commissions, product-specific caps, and additional fees |
The key distinction is between testing a market idea and testing an options position. A stock can rise while a purchased call loses value because of the premium paid, time decay, a volatility change, or an unfavorable fill.
1. LuxAlgo: research and develop rules on native charts
LuxAlgo’s native chart workspace lets you choose the symbol, timeframe, chart style, and layout. Where your plan supports multiple charts, you can compare one market across timeframes or several markets on a matching interval.
Click the chart you intend to work on first: symbol changes, indicators, and Quant scripts target the active cell. Sync Symbol, Interval, and Crosshair independently when a linked view helps your research.
What Quant contributes
Quant is our coding agent. Describe a specific entry and exit rule, review the generated Code, and Run the strategy on your selected chart. The strategy workflow supports changing script inputs and simulation properties such as capital, order size, commission, and slippage.
A useful starting prompt is: “Create a long-only strategy that enters after a close above the previous 20-bar high and exits after a close below the previous 10-bar low. Exclude the current bar from both reference ranges and expose the lengths as inputs.” Review the code to confirm that it implements those rules, then examine drawdowns and individual trades as well as total profit.
This tests a price-based hypothesis. It does not automatically select a call’s strike and expiration, reconstruct historical option quotes, or model assignment. Those are separate requirements for an options strategy.
Indicators
Use the LuxAlgo indicator library to explore studies that help define or visualize a setup. A trend indicator, volatility measure, or volume study can provide context; none establishes that an option is underpriced or suitable.
Cost check: Compare the current LuxAlgo plans by the credits, layouts, history, and features you need. A research subscription and a broker’s per-contract commission pay for different services, so they should not be ranked as equivalent “options fees.”
2. thinkorswim: evaluate contracts and practice position management
Schwab’s thinkorswim combines charting with options tools. Its Risk Profile can help visualize a position under changes in underlying price, time, and implied volatility. These are model scenarios, not promised profits or realized fills.
Use paperMoney to rehearse building an order, reviewing its position effect, and managing a simulated trade. A practice environment helps with platform mechanics; it does not reproduce every live liquidity, routing, or assignment condition.
Read options statistics with the correct definitions
thinkorswim’s options statistics include volatility measures, the Sizzle Index, and put/call volume. They answer different questions:
- Sizzle Index: Current total put-and-call option volume divided by average daily option volume over the previous five days. A value of 2 means twice that daily average. It is not automatically a comparison with the same time of day.
- Put/call ratio: Put volume divided by call volume. Equal quantities give 1.0. A reading of 0.5 means half as many puts as calls, not equal volume.
- Implied volatility: A model-implied measure derived from option prices. It is different from volatility calculated from past underlying returns.
See the Sizzle Index manual, scan-filter definitions, and Schwab’s options-statistics guide. Volume alone does not reveal whether every trade opened or closed exposure, and neither ratio supplies a universal bullish or bearish threshold.

Cost check: Schwab’s pricing guide lists a $0 online base commission plus $0.65 per options contract. The online buy-to-close contract-fee waiver applies at a price of $0.05 or less. Additional charges may apply, and the total contract count across legs matters.
3. tastytrade: build and analyze the options position
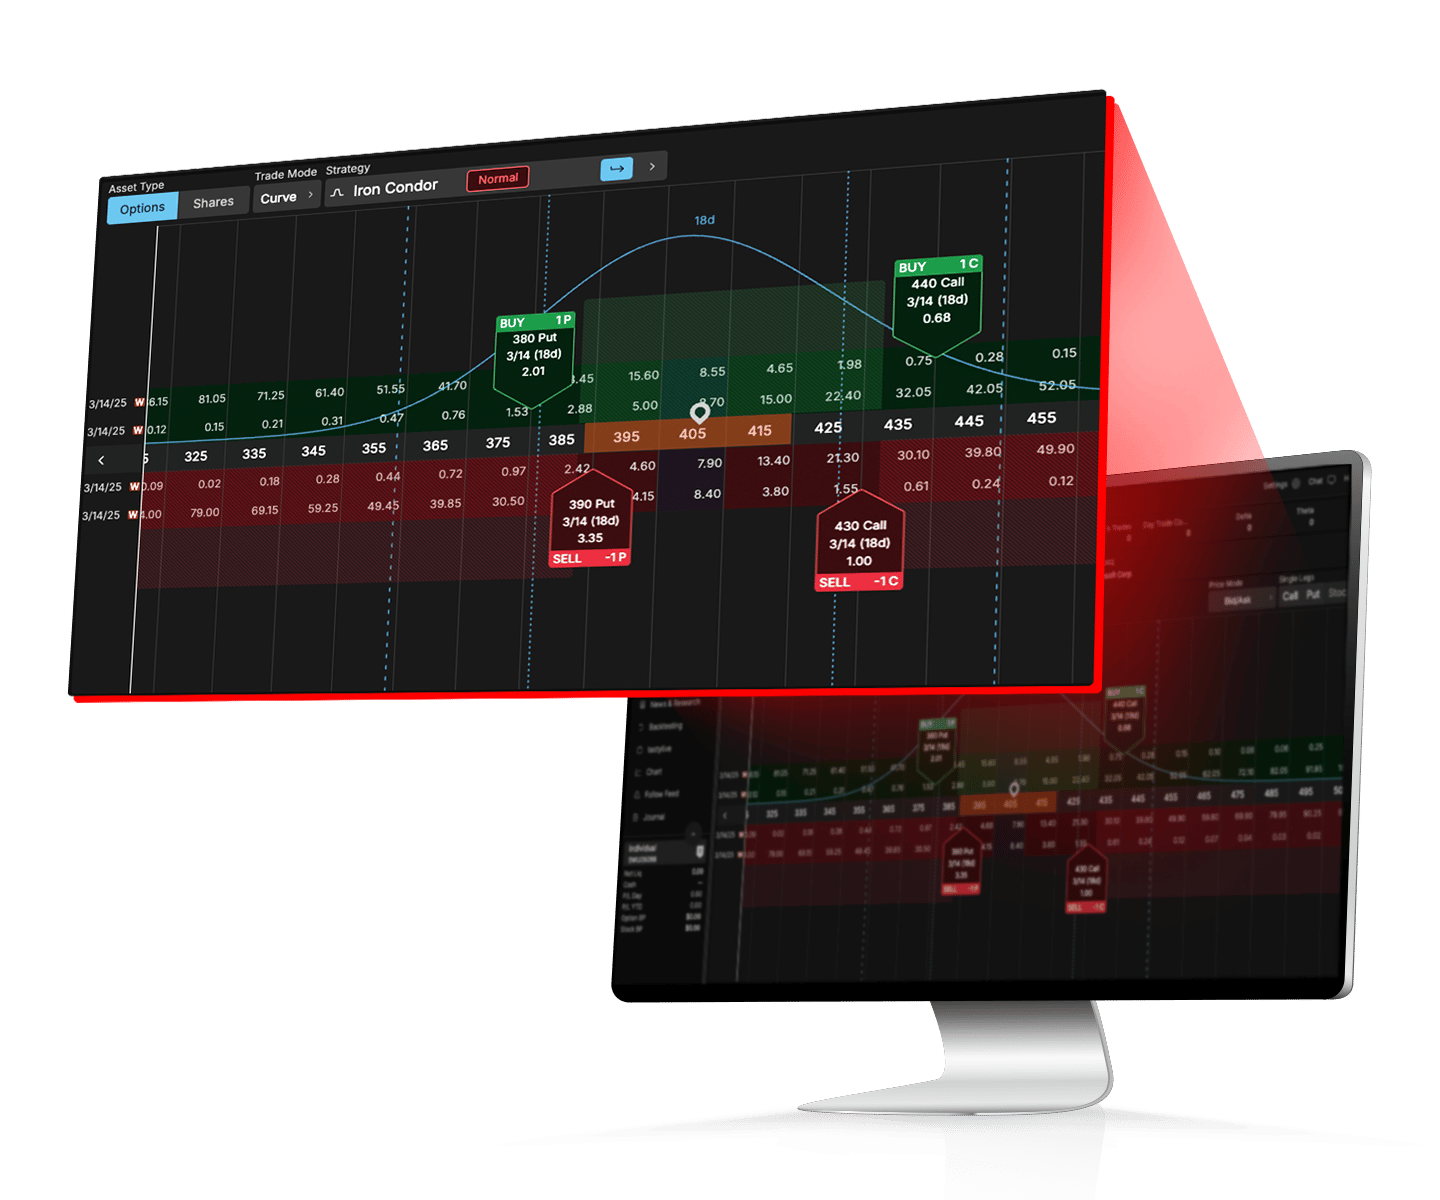
tastytrade’s options tools include a strategy selector, Curve View, and order chains for following multi-leg and rolled positions. Compare the visual payoff with the actual order ticket: long versus short, calls versus puts, expiration, strike, quantity, and net debit or credit.
Historical options tests are a separate feature
The Options Backtesting tool supports historical tests with inputs such as strategy, quantity, strike delta, expiration, and exit conditions for available symbols. It provides summaries, trade details, and transaction logs.
Before interpreting a result, inspect the date range, contract-selection rules, concurrent positions, exits, and cost or fill assumptions. Do not assume that a historical test can reproduce any custom rule or every symbol. Compare the strategy with a relevant benchmark and reserve unseen data for validation rather than repeatedly tuning to the same sample.
Cost check: The published schedule charges $1 per stock/ETF option contract to open, capped at $10 per leg, with $0 closing commission. Broad-based index options are excluded from that cap. Applicable exchange, clearing, and regulatory fees can remain on opening and closing trades, so “zero closing commission” is not “free to close.”
Integration check: tastytrade offers an API, but a custom integration requires its own implementation and testing. When using any external charting connection, verify the supported instruments, order types, data, and account permissions. An integration label does not establish that every native options feature transfers to the connected platform.
A worked feature test: one vertical spread
Suppose you want to compare tools using a hypothetical 100/105 bull call spread costing $2 per share, with one standard 100-share contract on each leg and a common expiration.
- The opening debit is $200 before costs.
- At expiration, the spread’s maximum value is $500, making the maximum profit $300 before costs.
- The maximum expiration loss is the $200 debit, and the expiration break-even is $102.
These are expiration-payoff calculations. Earlier valuations depend on time and volatility, while early assignment or closing one leg can create different exposures. Use the OIC bull-call-spread guide for the strategy’s mechanics.
| Test | What a useful tool should help you inspect |
|---|---|
| Underlying thesis | Why the price setup supports the planned direction and holding period |
| Contract construction | Both strikes, matching expirations, long/short sides, quantities, and quoted net debit |
| Scenario analysis | Expiration payoff versus earlier values under changed price and volatility assumptions |
| Order preview | Limit price, total fees, buying power, and permitted position effect |
| Management | How to close the spread, handle a partial fill, and inspect the remaining position |
| Recordkeeping | Actual fills, fees, timestamps, and notes that explain deviations from the plan |
LuxAlgo helps develop the underlying thesis; the broker’s contract and order tools address the actual spread. Test the complete workflow on your usual device. A long feature list is less useful than being able to inspect and manage the position accurately.
Video: another trader’s options-tool workflow
Options Trading IQ’s “The Best Tools for Trading Options – My 5 Favorites” offers a personal view of research tools. Treat it as a workflow example rather than a current fee schedule or an independent performance ranking.
Choose tools by the decisions they improve
For a beginner, prioritize education, understandable order controls, simulation, and support. For a systematic trader, prioritize explicit rules, data coverage, reproducible tests, and exportable records. For an active options trader, inspect contract selection, risk analysis, position management, and all-in costs.
No platform makes an unsuitable options position safe. Confirm account eligibility and strategy permissions, and understand exercise, assignment, and buying-power requirements. Use LuxAlgo’s native charts and Quant to make the research clearer, then evaluate the actual contract and execution separately.
FAQs
What should I look for in an options trading platform?
Check the contracts and strategies available to your account, clear order controls, payoff analysis, practice tools, total fees, and support. Test a complete workflow from research to closing a position on the device you actually use.
How can LuxAlgo help with an options trading strategy?
LuxAlgo’s native charts and Quant help develop and test price-based ideas on supported chart data. Use options-specific tools to evaluate strike, expiration, volatility, liquidity, and execution. A backtest of the underlying market does not establish the return of an option on it.
Why consider thinkorswim when learning options?
thinkorswim provides options-analysis tools and paperMoney simulation for practicing platform mechanics. The interface still takes time to learn, and simulated results do not establish live fills or eliminate options risk. Confirm account eligibility and required approvals.
Read next