Edgewonk: Journal Tool Analysis

Edgewonk is a trading journal that has been sold on one argument for more than a decade: the numbers in a journal are only half the record, and the other half is the behaviour that produced them. Its analytics track setups, timing, trade management and performance ratios like any serious journal, but its distinctive tools measure discipline directly, a Tiltmeter that overlays rule-breaking streaks on the equity curve, mistake tags priced in lost profit, an automated Edge Finder that separates a strategy's true edge from the cost of not following it. This analysis breaks the tool down by what it records, what it computes and what it asks of the trader, states the current price and terms, and then sets the same functions beside the Journal on Quant Charts, LuxAlgo's charting and AI platform, where fills are logged on the chart, an Edge Score measures repeatability, and Quant, the coding agent, can backtest the setup the journal says is working.
Key points:
- Edgewonk prices discipline. Its Edge Finder reports the profit lost to rule breaks and the result the system would have produced had the rules been followed.
- One price, everything included. A single annual plan covers unlimited journals, accounts, trades and strategies; in September 2026 it was sold as $197 for sixteen months.
- Imports are broad, charting is not the point. Fast import for MetaTrader brokers and prop firms, auto-sync for many platforms, Excel for the rest; it is a journal, not a charting platform.
- The Quant Charts Journal covers the same record beside the chart and adds the test a journal cannot run: Quant's Backtest Summary for the setup itself.
What Edgewonk Records
A journal is only as good as what gets into it, and Edgewonk's import page describes three routes. Fast import handles MetaTrader 4 and 5 statements from a long list of brokers and prop firms, with auto-sync available for any MetaTrader broker. A second list of platforms supports direct import or sync, including Interactive Brokers, Charles Schwab and thinkorswim, E*TRADE, Fidelity, NinjaTrader, Tradovate, TradeStation, Sierra Chart, cTrader, Quantower, TradingView paper trading and exports from other journals such as TraderSync, Tradervue and TradeZella. Anything else comes in through an Excel template, and the page claims a thousand trades import in under twelve seconds. The pricing page lists what each trade can carry: up to twenty custom tag categories, six screenshots per trade, commissions and fees, setup checklists, and a notebook with image upload, across unlimited journals and accounts in any currency for forex, stocks, futures, crypto, options, indices and commodities.
Two record-keeping features are less common. Missed trades can be logged and analysed alongside taken ones, with the reason for passing, so hesitation and confidence problems become visible in the data rather than only in memory. And checklists are attached to setups: each trade records which criteria were met, so the journal can later report which rules actually correlate with profit and how often you follow them, which the Chart Lab page calls turning rules into results.
What Edgewonk Computes
The analysis layer is organised into three parts. The Chart Lab holds the visual reports: performance by strategy and setup, by month, weekday, hour and thirty-minute window, by behaviour tag with the cost of each mistake, by trade management (whether winners are cut early and losers held long), and by performance ratio over time, with win rate, Sharpe, Sortino and profit factor among those listed. The Trading Psychology Lab holds the behavioural tools described below. And the Edge Finder runs an automated scan of the whole journal every Sunday and reports a fixed set of findings.
| Edge Finder finding | What it reports | How to read it |
|---|---|---|
| Winrate check | Win rate, its weekly change, and the break-even reward-to-risk ratio | A win rate below what your average reward-to-risk needs to break even is a system problem, not a discipline one |
| Most profitable times | The periods in which performance is strongest | Concentrate size and attention there; treat weak windows as candidates to stop trading |
| Total Edge Leak | How much performance is lost when rules are broken | The clearest number in the tool; if it exceeds net profit, the strategy is fine and the trader is the problem |
| Most expensive mistakes | The entry, exit and management comments with the most negative results | Fix the single costliest pattern first; one fix usually moves the whole curve |
| True System Edge | Profitability with rule-break trades removed | The result the system was designed to produce; compare it with realised results to see the gap discipline would close |
| Return-to-drawdown | Return relative to drawdown across horizons | Stable across horizons means the results are robust; fragile means one bad stretch would erase them |
| Discipline efficiency | How consistently rules are followed | Track the trend, not the level; improving efficiency with flat profit means the system needs work next |
The Library supplies the definitions behind these reports. The expectancy entry explains why a win rate is meaningless without the payoff ratio, which is exactly what the Winrate check's break-even reward-to-risk figure encodes; the drawdown statistics entry covers the recovery and return-to-drawdown reading behind the risk finding; and the Sharpe and Sortino entries define the two ratios the Chart Lab tracks over time, the second penalising only downside volatility.
What Edgewonk Asks of the Trader
The psychology tools are where Edgewonk differs most from a statistics-first journal, and they are demanding by design. The Tiltmeter visualises discipline as streaks of strong and weak behaviour and can be overlaid on the equity curve, so the connection between a run of rule breaks and a drawdown is drawn rather than argued. Mental tags let you define your own psychological variables, confidence, focus, stress, impulsiveness, and tag trades with them, so those states become statistics with a P&L attached. Sessions structure the daily, weekly or monthly review with report cards, reflection prompts and lesson tracking, and the Notebook is a full diary with categories for plans, reviews and lessons. None of this works unless it is filled in honestly after every session, which is the real cost of the tool and the reason it suits traders who already believe their problem is execution rather than strategy.
The Library's loss control rules entry is the natural companion: daily loss limits, trade-count caps and cooling-off rules are exactly the rules whose breaches the Tiltmeter and Total Edge Leak price, and the equity-curve throttling entry describes the systematic version, cutting size when the curve is below its average, which a journal that overlays discipline on the curve makes easy to justify.
Price and Terms
Edgewonk sells one plan with every feature included. On 11 September 2026 the pricing page offered it as sixteen months for the price of twelve at $197, billed every sixteen months in US dollars with VAT added at checkout in the EU and UK, under a fourteen-day full refund and a promise to lock the price for life; the page's FAQ describes the standard term as an annual subscription that can be cancelled at the end of the period, and one older passage on the same page still quotes $169, so confirm the figure at checkout. What the price buys is unlimited journals, accounts, trades and strategies, all markets, the full analysis and psychology tool set, a portfolio page combining all journals, weekly product updates and support. There is no free tier and no monthly billing option shown.
The home page adds the trust claims a buyer should weigh: more than eight million trades journaled, more than ten years in operation, a statement that journal data is never sold, analysed or used to reverse-engineer strategies and is only accessed at the user's explicit request, and independent penetration testing of the systems. Those are the vendor's claims; the privacy statement is the one to read before importing a live account.
Where It Fits Among Journals
Edgewonk is a journal and analysis tool, not a charting platform and not a broker integration in the live-trading sense: it imports and syncs history, it does not show you a live chart or place orders. Its comparative strengths are the behavioural layer, the checklist-driven setup tracking and a flat price that does not scale with accounts or trade count. Its trade-offs are the reverse: no per-tier entry price for occasional traders, and an analysis depth that repays only the trader who fills in the behavioural fields. Traders who want broker-sync-first journaling with a market replay simulator and a conversational AI layer will find that model covered in our TraderSync review and TraderSync breakdown; the broader argument that trade management is a strategy problem before it is a psychology problem is made in this earlier article.
The Same Functions on Quant Charts
The Journal on Quant Charts is included on every plan and sits beside the chart rather than in a separate application. Its accounts take fills three ways: a connected broker that syncs daily, an imported statement in CSV, TXT or HTML with the format detected automatically, including Interactive Brokers, MetaTrader 4 and 5, thinkorswim and Schwab, TradingView paper trading, NinjaTrader, Tradovate, TopstepX, Webull, DAS Trader Pro and exports from TradeZella and Tradervue, or a manual account with an initial balance and a FIFO, LIFO or weighted-average matching rule. Fills can be logged straight from the chart with the Journal Trade tool, which captures the clicked bar's time and price, and journaled trades paint on the price pane as an entry triangle, an exit flag and a dashed line carrying the net P&L.
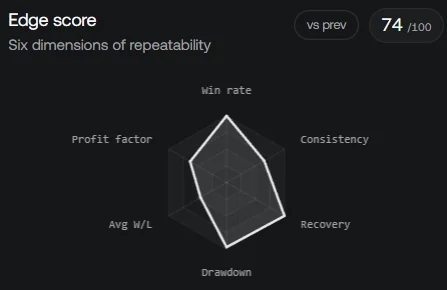
The dashboard is the counterpart to Edgewonk's ratios and Edge Finder findings: net P&L, win rate, profit factor, average win against average loss and day win rate as cards with deltas against the previous period, an equity curve with a compare overlay, drawdown in currency or as a percent of initial balance, a calendar coloured by result, a Risk and Behaviour strip with maximum drawdown, expectancy per trade, average duration, current streak and best and worst day, and the Edge Score. The Breakdown page slices P&L by weekday, entry hour, hold time, symbol, side and position size, and by the Tag and Rating you save on each trade in review, writing a short automatic read when a slice has at least three trades, which is the Chart Lab's time and setup analysis done from the same table. Day notes and per-trade notes live in the Notes page and can be written from the chart with the Journal Note tool.
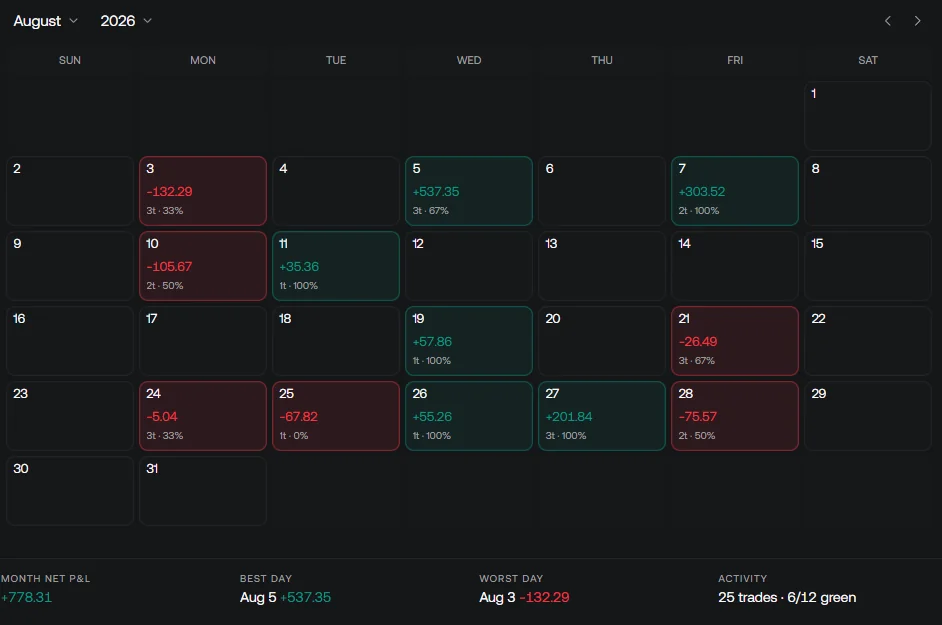
What the Quant Charts Journal does not do is Edgewonk's behavioural accounting: there is no Tiltmeter, no mental tags, no checklist adherence score and no automated Sunday scan. Tag and Rating are the review fields available, so a trader who wants a discipline metric records rule adherence in the Rating and reads it through Breakdown. What it does that a journal cannot is the test. Describe the setup the journal says is working to Quant in plain language, as an entry, a stop and an exit; Quant writes the Pine Script as a strategy, you inspect it under Code and click Run, and the Backtest Summary reports net profit, trade count, win rate, maximum drawdown and profit factor across the chart's history, with commission and slippage set in the strategy Properties so the result is costed. Edgewonk's True System Edge tells you what your system would have made on the trades you took if you had followed it; the Backtest Summary tells you what the rule would have made on every qualifying bar, and the two together separate the three questions a struggling trader confuses: does the system work, do I follow it, and do I take enough of its trades.
Where Each Tool Stops
Edgewonk stops at the record and its behavioural analysis: it imports, tags, scores and reports, and it does not chart live markets, backtest a rule across history or route orders. The Quant Charts Journal stops at the record on the chart plus the test: fills, notes, tags, dashboard, Breakdown and Quant's Backtest Summary, with no behavioural scoring beyond Tag and Rating and no order routing, because the LuxAlgo platform does not place orders for you.
Conclusion
Edgewonk's case is that most traders lose less to their strategy than to the gap between the strategy and what they actually do, and its tools are built to measure that gap: the Tiltmeter draws it, the mistake tags price it, and the Edge Finder reports both the leak and the system's true edge every Sunday. At one flat price with everything included, it is a good fit for the trader who is willing to log behaviour as carefully as fills. The Quant Charts Journal keeps the same record beside the chart, scores repeatability with the Edge Score and slices results in Breakdown, and adds the one measurement a journal cannot take: Quant writing the setup as a strategy so the Backtest Summary can show whether the system deserves the discipline in the first place.
Key Takeaways
- Edgewonk measures discipline directly: Tiltmeter streaks on the equity curve, priced mistake tags, and an Edge Finder that reports the leak from rule breaks and the system's true edge.
- Imports cover MetaTrader brokers and prop firms, a long auto-sync list and an Excel template; checklists and missed trades are logged alongside fills.
- One plan includes everything; in September 2026 it was $197 for sixteen months with a fourteen-day refund and no monthly option.
- The Quant Charts Journal logs fills on the chart, scores repeatability with the Edge Score and slices P&L in Breakdown.
- Quant's Backtest Summary answers the question a journal cannot: whether the rule itself has an edge across history.
FAQs
What is Edgewonk?
Edgewonk is a trading journal for forex, stocks, futures, crypto, options, indices and commodities that imports trades from MetaTrader brokers, many platforms and Excel, then analyses setups, timing, trade management and performance ratios alongside behavioural tools such as the Tiltmeter, mental tags, session report cards and an automated Edge Finder scan every Sunday.
How much does Edgewonk cost?
In September 2026 the pricing page offered a single all-features plan as sixteen months for the price of twelve at $197, billed every sixteen months in US dollars with VAT added in the EU and UK, under a fourteen-day money-back guarantee. The FAQ describes the standard term as annual, one passage still quotes $169, and no free tier or monthly option is shown.
What does the Edge Finder do?
Every Sunday it scans the whole journal and reports a fixed set of findings: a win-rate check with the break-even reward-to-risk ratio, the most profitable times, the Total Edge Leak lost to rule breaks, the most expensive mistakes, the True System Edge with rule-break trades removed, a return-to-drawdown reading and a discipline efficiency measure.
What is the Tiltmeter?
A visualisation of discipline as streaks of strong and weak behaviour, based on the rule-adherence and mistake tags recorded on each trade, which can be overlaid on the equity curve so the link between rule breaks and drawdowns is visible.
How does the Quant Charts Journal compare?
It is included on every plan, takes broker sync, statement imports and manual fills logged from the chart, and reports net P&L, win rate, profit factor, expectancy, drawdown and an Edge Score after five closed trades, with a Breakdown page by weekday, hour, symbol, side, size, tag and rating. It has no Tiltmeter or automated scan, and it pairs with Quant's Backtest Summary to test the setup itself.
Should I fix discipline or the system first?
Measure both. Edgewonk's True System Edge shows what the system would have made on the trades you took if the rules had been followed; a Backtest Summary on Quant Charts shows what the rule would have made on every qualifying bar with costs. If the backtest is poor, discipline will not save it; if it is good and the journal shows a large edge leak, the work is behavioural.
References
LuxAlgo Resources
- Quant Charts
- Journal overview
- Journal accounts: broker sync, imports, manual books
- Journal dashboard and Edge Score
- Journal breakdown
- Journal notes
- Quant: making strategies and the Backtest Summary
- Library concept: expectancy
- Library concept: drawdown statistics
- Library concept: Sharpe ratio
- Library concept: Sortino ratio
- Library concept: loss control rules
- Library concept: equity-curve-based throttling
- LuxAlgo Blog: TraderSync review
- LuxAlgo Blog: TraderSync trade journal breakdown
- LuxAlgo Blog: trade management beyond psychology
External Resources
Read next