Finviz: Market Screener Analysis
Finviz helps traders narrow a broad stock universe into a manageable research list. Its screener combines company fundamentals, price behavior, and liquidity filters, while maps and charts help you inspect the results. It is useful for finding candidates; deciding whether a candidate supports a repeatable trading strategy requires further work.
A practical workflow is to screen in Finviz, investigate selected symbols on LuxAlgo’s Quant Charts, and use Quant, our coding agent, to develop explicit trading rules for testing. Finviz’s filters and a strategy backtest answer different questions: what matches now, and how defined rules behaved historically.
Product features and pricing checked September 8, 2026. Examples illustrate research methods and are not recommended stock selections.
Key Features
- Combine descriptive, fundamental, and technical filters to build a shortlist.
- Use market maps and chart patterns to investigate sector context and price structure.
- Save screens and organize portfolios; paid features add real-time equity data, enhanced charts, alerts, and exports.
Free vs. Elite: Quick Comparison
The current Finviz comparison distinguishes a registered free account from Elite. Free registration already includes portfolios; Elite increases their capacity.
| Feature | Free account | Elite |
|---|---|---|
| Equity quotes and screening data | Delayed | Real-time |
| Interactive multi-layout and intraday charts | Not included | Included |
| Saved screening presets | 50 | 200 |
| Portfolios / tickers per portfolio | 50 / 50 | 100 / 500 |
| Email and push alerts | Not included | Included |
| Excel exports and APIs | Not included | Included for listed datasets |
Finviz’s pricing and data FAQ lists Elite at $39.50 with monthly billing or $299.50 billed annually, approximately $24.96 per month on the annual plan. The seven-day trial automatically becomes a paid subscription unless canceled before it ends. Check the selected billing period and renewal terms.
The FAQ describes a one-minute delay for free stock quotes. Real-time equity access does not mean every field refreshes on each trade: company fundamentals follow reported releases, and futures and options remain delayed. Check the timestamp and market before using a displayed price for a time-sensitive decision.
Find Stocks to Research: Three Finviz Scan Setups
This Trade Brigade tutorial, published October 18, 2022, demonstrates uptrend, downtrend, and short-squeeze screens. It remains useful for understanding how filters combine, but its interface is historical. Treat its setup suggestions as hypotheses to investigate; a high short-interest reading or chart pattern does not establish that a squeeze or profitable trade will follow.
Stock Screening Tools
Screen Interface Guide
Open the Finviz screener, set your universe, and add a few filters before inspecting the results. Use the overview to identify companies, then valuation, financial, technical, or chart views to answer specific questions. The country filter concerns companies listed in U.S. markets; it is not a search across every overseas exchange.
Filter Categories: Basic and Advanced
| Category | Examples | Research purpose |
|---|---|---|
| Descriptive | Exchange, sector, market capitalization, average volume | Define the market and liquidity range you want to study |
| Fundamental | P/E, EPS growth, profit margin, debt/equity | Compare business performance and valuation |
| Technical | Moving averages, RSI, price performance, patterns | Find price conditions that fit a written hypothesis |
Use the official filter definitions when a label is ambiguous. Average Volume covers the recent three-month period; Current Volume refers to today or the last session. The “EPS growth qtr over qtr” field compares the latest quarter with the corresponding quarter a year earlier. These are different measurements from today’s activity or growth against the immediately preceding quarter.
A low P/E is not sufficient evidence of value: earnings may be temporarily elevated or declining. Compare similar businesses and inspect recent reports. Likewise, an RSI threshold identifies a momentum condition rather than an automatic entry. Strong trends can remain overbought or oversold longer than expected.
Managing Custom Screens
Example momentum shortlist: start with Average Volume above 500,000 shares, price above the 20-day simple moving average, and positive EPS growth for the latest quarter measured year over year. These illustrative thresholds combine liquidity, trend, and business growth; they have not been established as an optimal strategy.
Save the combination as a preset with a descriptive name and record the screening date. Review spreads, upcoming earnings, recent news, and whether the move has already extended far beyond your planned entry. If too few results remain, relax one condition at a time and record why. Adding filters until only a familiar past winner survives is not a sound validation method.
Market Visualization Features
Heatmap and Sector Analysis
The Finviz market map lets you choose a universe, sizing method, and data display. Its standard S&P 500 map groups stocks by sector and industry, sizes tiles by market capitalization, and can color them by one-day performance. Check those controls before interpreting the picture; an equal-sized map tells a different visual story.
A large green tile can dominate a sector even when many smaller constituents decline. Compare individual members and a longer performance period before calling the move broad sector strength. A heatmap is context for further investigation, not a direct measure of future returns or a substitute for market-breadth analysis.
Charts and Pattern Tools
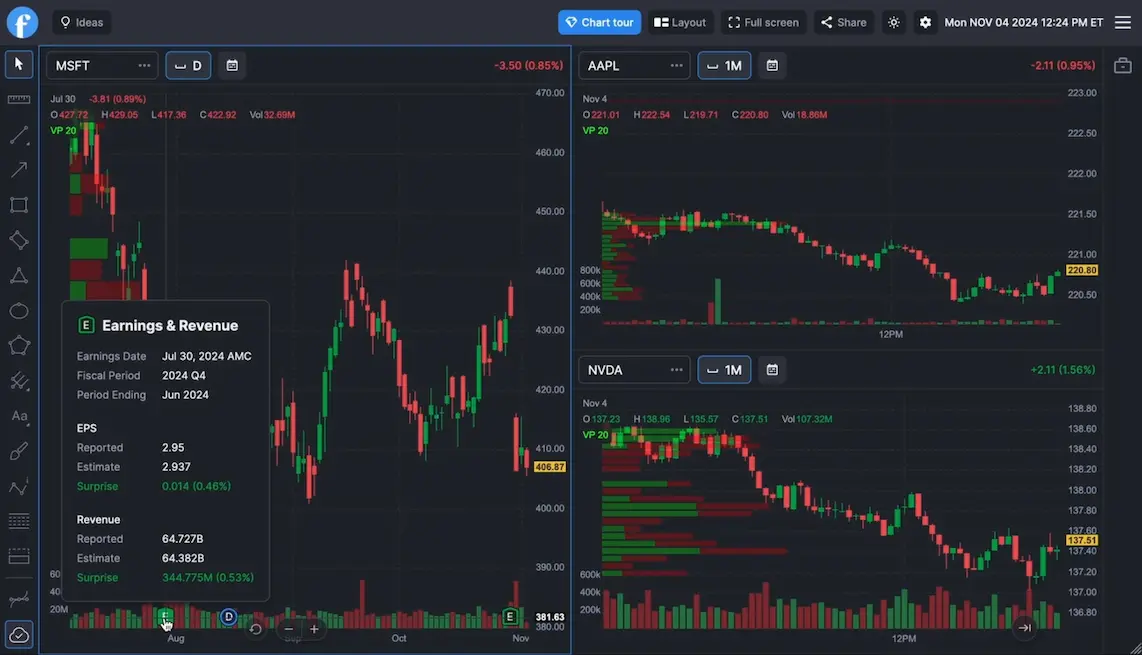
Elite’s interactive layouts allow several chart views and technical studies. Its current feature page also describes automatic pattern recognition. Use these tools to compare the same candidate across relevant timeframes, then inspect the underlying candles rather than relying only on a label.
Technical Analysis Tools
Chart Indicator Setup
Assign each indicator a job. A moving average can describe trend, RSI can summarize momentum, and volume can show whether participation changes around a level. Stacking several indicators derived from similar price inputs does not provide independent confirmation merely because they agree.
Keep the timeframe and data delay consistent with the question. A daily setup does not become an intraday entry rule without specifying when to act. Write down whether you require a completed candle, how long a signal remains valid, and what would invalidate it. That converts a visual impression into something you can review.
Pattern Detection and Testing
Finviz’s chart-pattern guide covers trendlines, channels, triangles, wedges, and double or multiple tops and bottoms. Head-and-shoulders formations are another familiar reversal concept to inspect manually; do not assume every pattern is a separate current screener option.
| Pattern family | What to inspect | Failure to plan for |
|---|---|---|
| Trendlines and channels | Repeated boundary tests and the location of a break | Price briefly crosses the boundary and returns inside |
| Double tops/bottoms or head and shoulders | Prior trend, intervening levels, and a completed break | The apparent reversal remains a range or resumes the old trend |
| Triangles and wedges | Converging boundaries, breakout direction, and participation | An early directional assumption fails before confirmation |
Volume can be one condition in a breakout rule, but it cannot guarantee follow-through. Specify entry, invalidation, position size, and exit before evaluating results. A recognizable pattern without those details is an observation, not a complete trading system.
Backtesting availability: the current public Elite feature list does not advertise the older Finviz backtester. Confirm availability directly before paying specifically for that legacy feature. Historical reviews and return claims should not be treated as evidence of what a new subscription provides today.
Evaluate a strategy using its trade count, drawdown, costs, and behavior on a separate test period. A Sharpe ratio above 1 is not a guarantee of consistency; it depends on the return sample and calculation assumptions. For example, 12 profitable trades out of 20 gives a 60% win rate, but average winners of $50 and average losers of $100 produce a $200 loss before costs. Win rate alone misses that result.
Daily Trading Workflow
Alert Configuration
Elite lists email and push notifications for prices, news, ratings, insider activity, and SEC filings, alongside portfolio or screener notifications. Give each alert a specific purpose: a candidate newly matching a screen warrants review; a news alert calls for reading the announcement. Neither is confirmation of an executed trade.
Research Finviz Candidates with LuxAlgo
Use Finviz for the initial cross-sectional screen, then bring selected symbols into LuxAlgo for chart research. This is a manual workflow, not a claim of automatic Finviz synchronization. In LuxAlgo, open Watchlist from Panels, add a symbol, and select its row to change the active chart. The advanced view provides financial information and news for closer inspection.

On Quant Charts, compare the candidate’s trend, nearby levels, and relevant timeframe. The Library’s market-structure and price-action tools cover structure and related concepts on the same chart.
For a testable price rule, ask Quant, our coding agent to create a strategy that enters after a completed daily close crosses above the 20-day moving average and exits after a close crosses below it, with one position at a time. Specify size and costs. Review the generated Code, sign in, and click Run on the intended symbol. Inspect whether the plotted entries and exits match your instructions.
This test evaluates the price rule on that chart. It does not automatically reconstruct which stocks passed a historical Finviz earnings-and-liquidity screen. Testing today’s survivors over the past introduces selection bias; a historical stock-selection study requires the universe and fundamentals available at each decision date.
Use the strategy viewer to review net profit, drawdown, and the Trades Log with realistic commission and slippage. Use standard price candles and a separate evaluation period. Compare several relevant symbols without repeatedly changing the rules to rescue disappointing results. Backtests describe simulated history, not live execution or guaranteed future performance.
Data Export Methods and Review Notes
Elite supports exports and APIs for listed data categories. Before building a spreadsheet or automated process, check the API and export access page and confirm the dataset, fields, authorization, and usage conditions in your account. Save the extraction date and filter settings with the file; an undated snapshot cannot establish what information was available historically.
Finviz also supports detailed transaction notes. Record why a candidate was selected, the planned holding period, invalidation level, and what actually happened. Keep missed or rejected ideas as well as successful trades so the review is not restricted to winners.
Conclusion
Platform Features and Advantages
Finviz is useful for narrowing stock research and seeing market context quickly. Start with the free account if delayed screening and its portfolio limits meet your needs; consider Elite when the specific chart, data, alert, or export features address a real constraint. LuxAlgo adds a focused environment for investigating the resulting charts and building explicit strategy tests with Quant.
Steps to Get Started
- Choose a universe and save one clearly named screen.
- Inspect each candidate’s chart, liquidity, earnings calendar, and news.
- Write complete trading rules before evaluating a strategy.
- Separate present-day screening from historical selection and price-rule testing.
- Record assumptions and outcomes, then revise the process using evidence.
References
Read next