Free Sites Similar to TradingView for Charts
A free charting platform should let you study a market, organize your analysis, and test an idea before you decide whether to pay. LuxAlgo’s Quant Charts combines browser-based charts, native Orderflow, and a built-in coding agent, making it our first pick here for traders who want to move from chart analysis to a custom indicator or backtested strategy in one workspace.
This guide compares eight free alternatives to TradingView by their charting tools, market data, customization, and practical limits. LuxAlgo publishes this comparison; the recommendations are based on the use cases below, rather than a universal ranking. Koyfin is useful for fundamental research, Finviz for stock screening, and a broker’s MetaTrader setup may suit traders who need execution alongside their charts.
Start with your workflow:
- LuxAlgo: chart analysis, native Orderflow on supported symbols, and custom indicators or strategies built with Quant.
- Koyfin: financial and macro data, customizable charts, and research dashboards.
- Investing.com: quick interactive charts alongside broad market coverage.
- StockCharts: daily and weekly technical analysis with educational resources.
- Finviz: U.S. stock screening, market maps, and pattern research.
- GoCharting: configurable browser charts, with market-specific data and orderflow plans.
- MetaTrader 4/5: broker-connected charting, especially for forex.
- ProRealTime Web: free browser charting without ads; check the separate Complete application for advanced workflows.
Product information checked September 2026. Free software does not necessarily include every exchange feed, historical depth, or feature available on a paid plan.
Quick Comparison
| Platform | Data access | Useful for | Free-plan considerations |
|---|---|---|---|
| LuxAlgo | Live on supported feeds | Quant Charts, native Orderflow, Library, coding and backtesting with Quant | 1 chart per tab; 5 tools plus Quant and volume; 500 monthly credits; 1-day Orderflow lookback |
| Koyfin | Varies by instrument and feed | Financial and macro charts, research dashboards | 2 watchlists, 2 screens, 2 dashboards; deeper research requires an upgrade |
| Investing.com | Live, delayed, or indicative by instrument | Interactive charts and broad market coverage | Ads and instrument-specific data limitations |
| StockCharts | Partial U.S. real-time; other feeds delayed | Daily/weekly technical charts and ChartSchool | 3 indicators and 3 overlays; no saved annotated charts |
| Finviz | Delayed in regular version | U.S. stock screening and market maps | Real-time stock quotes and extended-hours features require Elite |
| GoCharting | Varies by region and data subscription | Custom charts and Lipi scripting | Published India comparison: 2 charts/tab, 9,000 bars; advanced footprint charts require Premium |
| MetaTrader 4/5 | Broker-dependent | Charting, technical analysis, broker connection | Broker account, instruments, costs, and version determine the experience |
| ProRealTime Web | Depends on instrument and feed | Free browser charting without ads | Advanced Complete features and exchange data must be checked separately |
For charting and custom strategy research together, start with LuxAlgo. If your priority is company financials, screening a stock universe, or placing orders through an existing broker, compare the corresponding specialist below.
Best Free Alternatives to TradingView (2026)
1. LuxAlgo: charts, Orderflow, and custom strategy research
LuxAlgo is an AI trading & charting platform. Quant Charts are its own charts, engineered in-house, with drawing tools, indicators, watchlists, and saved workspaces. You can start with a chart and keep your analysis, coding, and backtesting in the same browser workspace.
Charting Tools and Customization Options
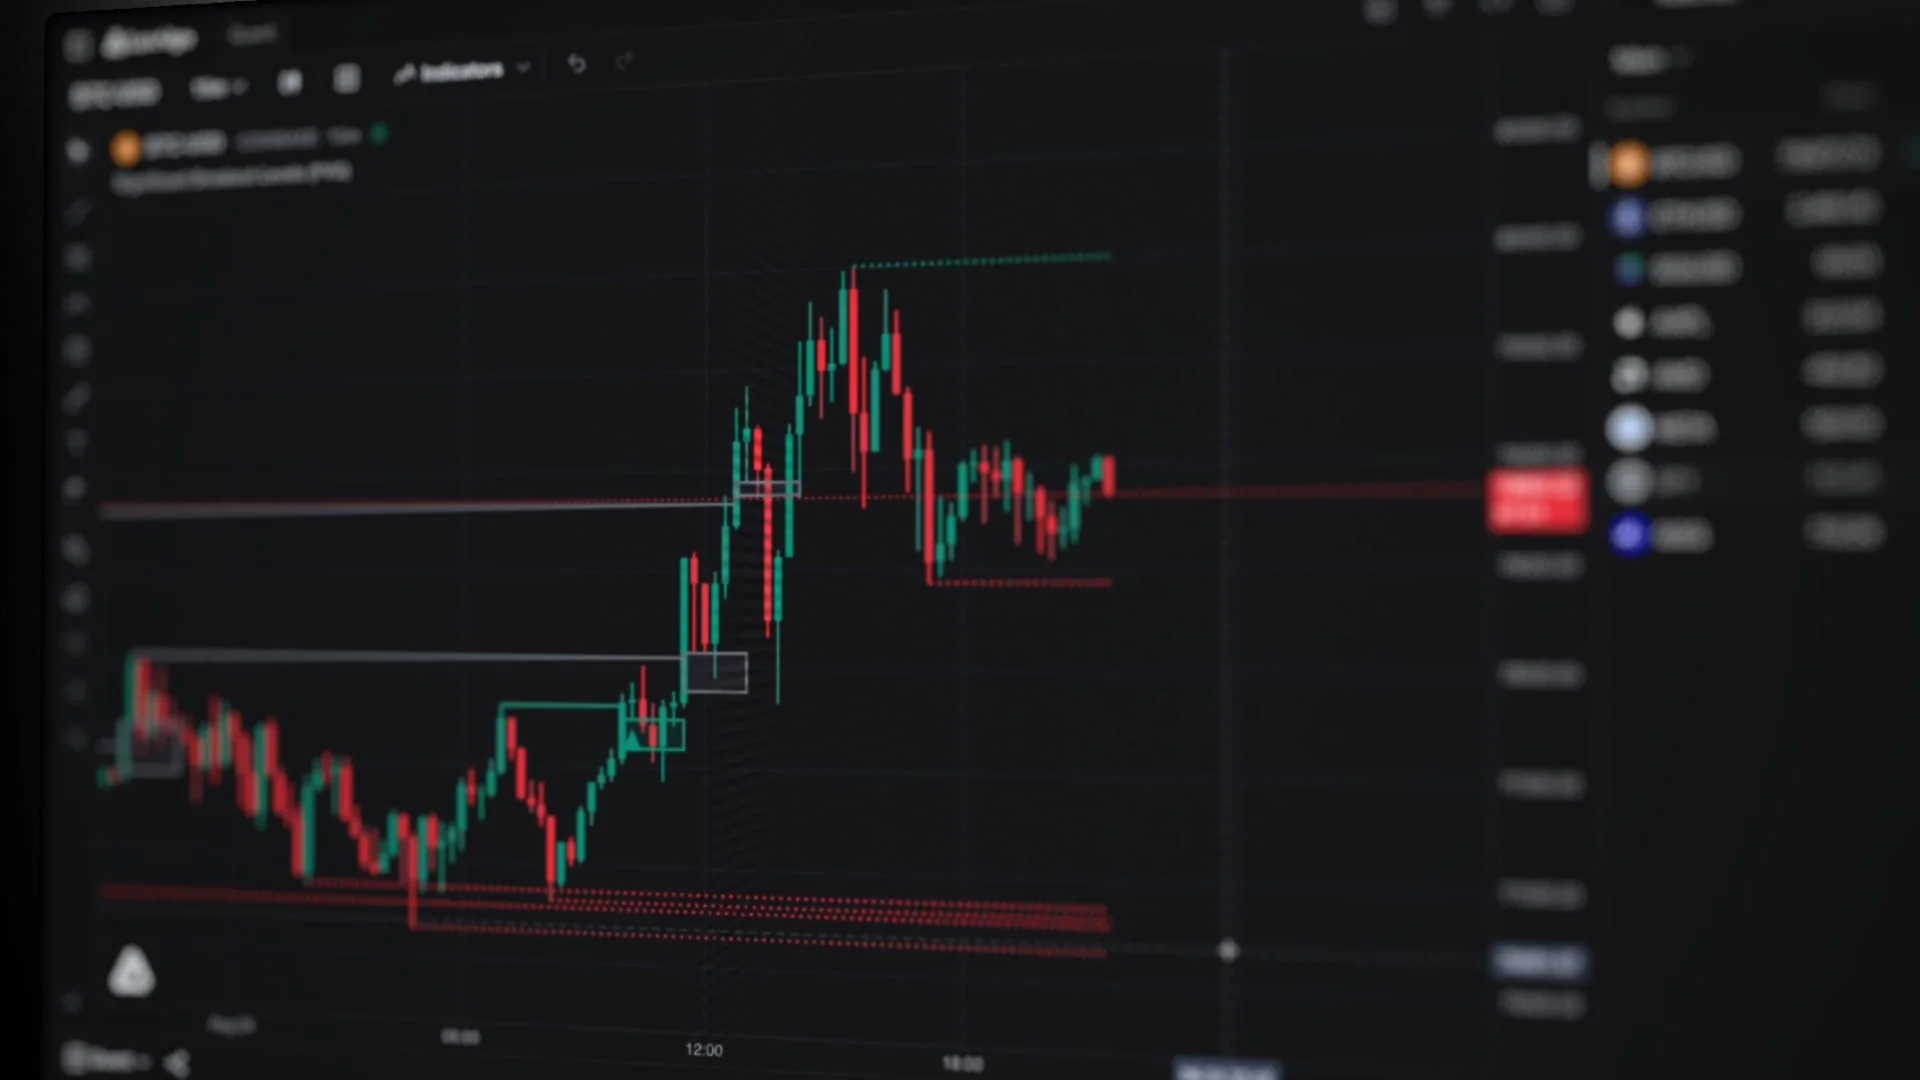
The drawing suite includes 66 tools across seven groups. Mark a trend, measure a move, or organize frequently used drawings in the radial wheel. Chart settings control price scales, colors, and the display; saved workspaces keep the setup available for your next session. Paid plans add multi-chart layouts, with limits set by the plan.
The LuxAlgo Library is built into the indicator picker alongside familiar studies such as RSI, MACD, and moving averages. Examples from LuxAlgo’s indicator collection include the Adaptive Momentum Oscillator, NR4 & NR7 with Breakouts, and RSI Candlestick Oscillator. Indicators remain useful building blocks: the platform lets you inspect their output and develop the idea further.
Quant, our coding agent, writes and repairs indicator and strategy code from a description. Review the Pine Script® code, run it on the active chart, and ask for a specific change. A strategy can then be evaluated with entries, exits, a performance summary, and a trade log. PineTS, LuxAlgo’s open-source Pine Script® runtime, provides the broader code-running foundation; Vela™, the open-source charting engine core, is a separate resource for developers building their own charting applications.
A practical chart-to-backtest workflow
- Choose the chart: open a supported stock or crypto symbol, choose a timeframe, and mark the levels you want to study.
- Define the rule: for example, ask Quant to plot a 20-period and 50-period EMA, then mark a crossover only after a candle closes.
- Make the test explicit: ask for a strategy that enters on the crossover and exits on the opposite crossover. Review the generated rules before running it.
- Evaluate the evidence: set commission and slippage, inspect trade count and drawdown, and compare another time period. A profitable historical result is not a promise of future performance.
The strategy-building guide and backtest viewer documentation explain the controls. This workflow is LuxAlgo’s strongest fit in this comparison: studying an idea and testing its rules without moving to a separate coding environment.
Real-time Data and Asset Coverage
Quant Charts uses its own platform data feeds. Crypto prices refer to the exchange selected for the symbol; U.S. equities use Cboe EDGX data, which represents that exchange rather than consolidated U.S. market volume. Live CME futures data requires a paid plan. Check current market access and plan limits for the instruments you need.
Native Orderflow tools include Footprint, TPO, volume delta, and volume profiles. Availability depends on the symbol and the underlying data. TPO measures time at price; a footprint measures executed volume at price. Neither should be confused with a live order book.
What the Free Plan Includes—and Where It Stops
- One chart per tab, five tools per chart in addition to Quant and volume, and 5,000 historical bars.
- Three saved workspaces, two watchlists with ten symbols each, and one strategy alert.
- 500 monthly credits for Quant and the shared AI balance, resetting on the first of the month.
- The full Orderflow suite with a one-day lookback, subject to the symbol’s data support.
These limits make Free useful for a focused chart and an initial custom study. Multiple simultaneous charts, deeper history, more credits, and webhook alerts require the appropriate paid plan. Native charts do not require a TradingView subscription. Compare the live plan table before choosing a tier.
Open the platform quickstart to set up your first chart, then add a study relevant to the question you are researching.
2. Koyfin
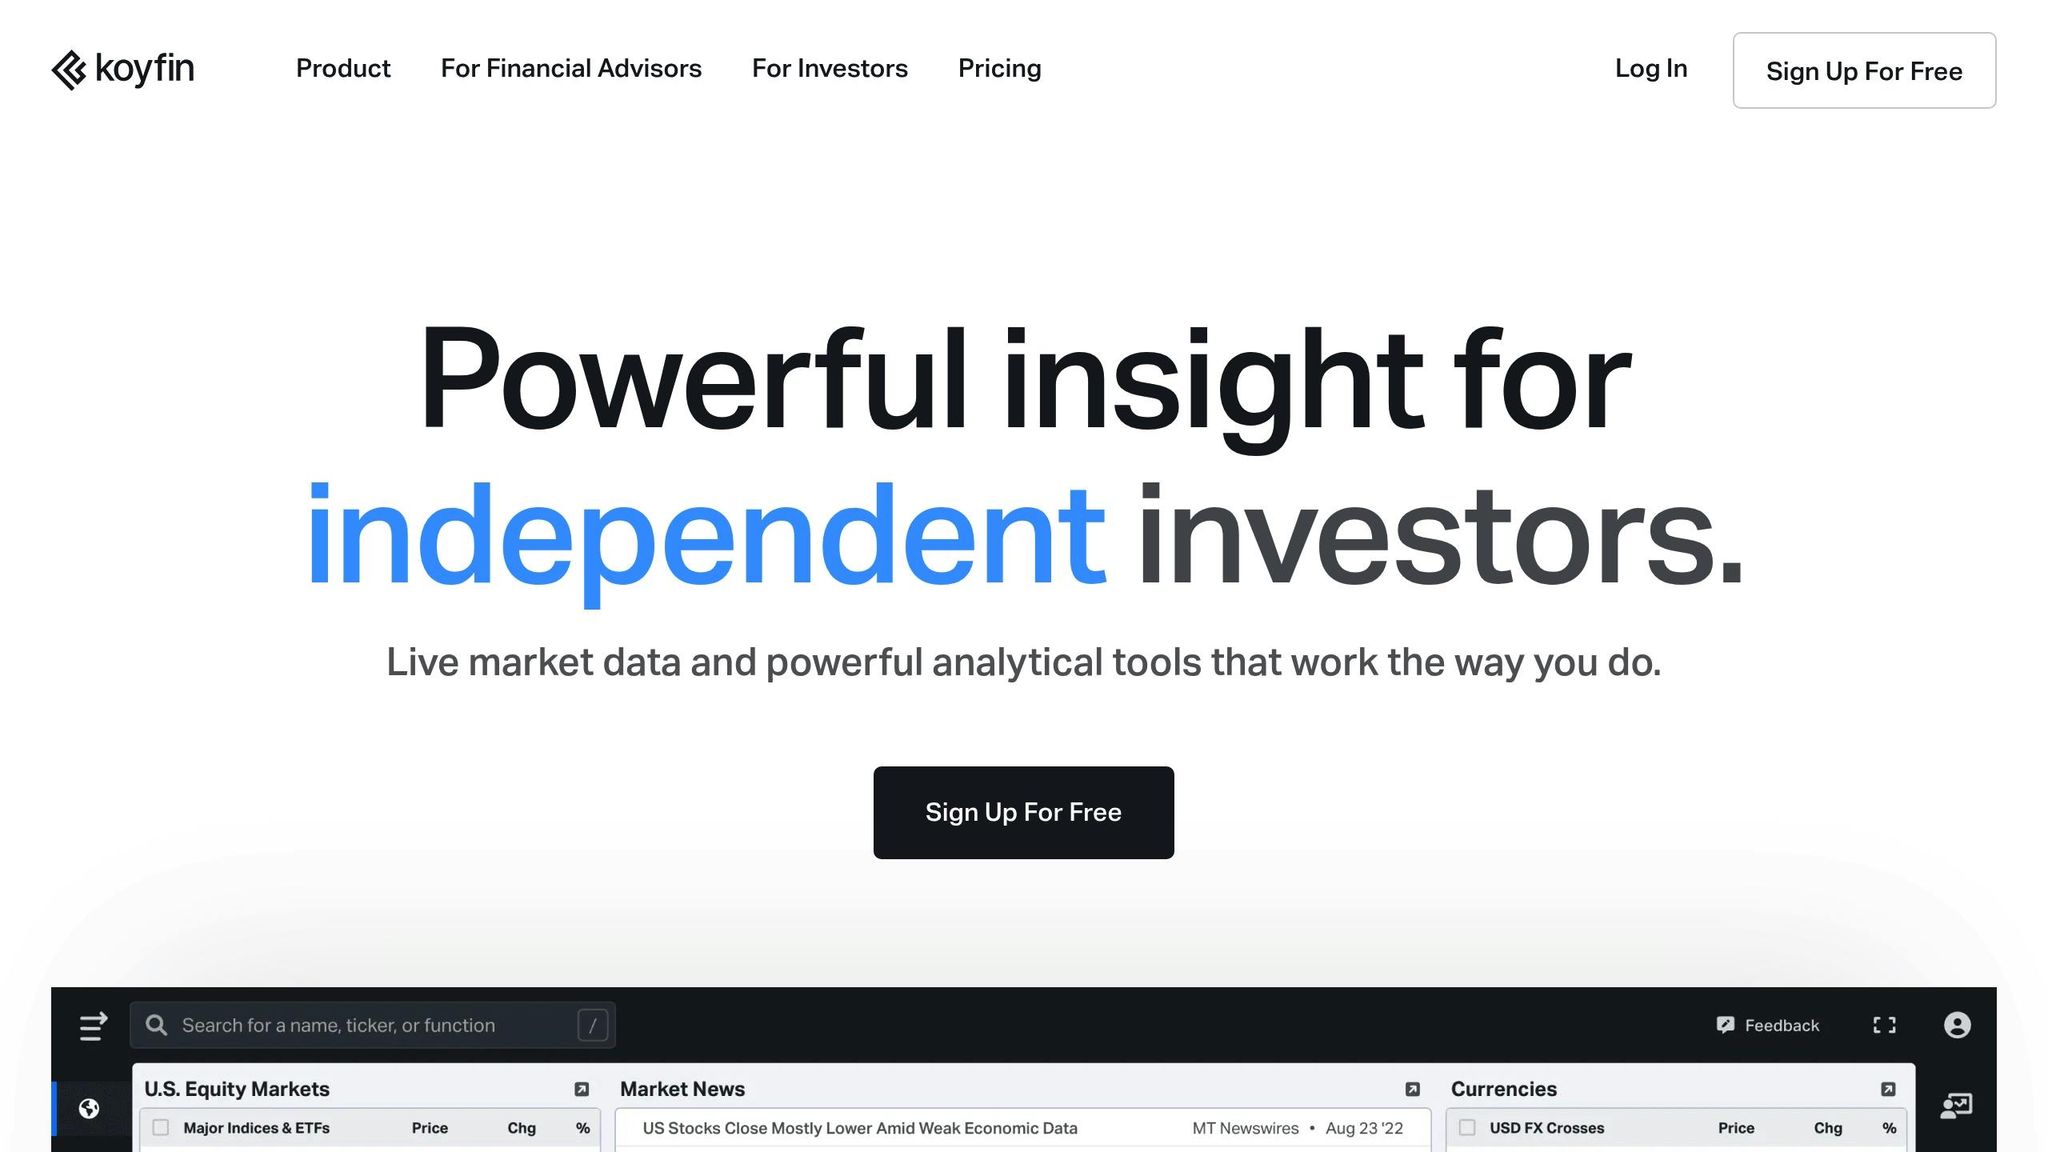
Koyfin is a platform used by investors and financial advisors. Its free, professional-grade charting tools have made it a go-to resource for seasoned traders.
Charting Tools and Customization Options
Koyfin combines price charts with financial and macroeconomic series, so its strength is comparing the data behind an investment idea. Here's a breakdown of its features:
| Feature Category | Available Tools |
|---|---|
| Chart Types | Bar, line, candlestick, area charts |
| Statistical Tools | Standard deviations, means, medians, ranges |
| Visual Elements | Colors, gridlines, labels, legends, axis styles |
| Data Transformations | Growth rates, cumulative performance, drawdowns |
Real-time Data Availability
Koyfin provides live or near–real-time market data across a variety of asset classes. Its panel-style design makes it easy to compare securities side by side, and users can save custom dashboards for quick access.
Asset Coverage
- Stocks and ETFs
- Government yields from 40 countries
- Global indices
- Commodities
- Cryptocurrencies
- Forex markets
- Macroeconomic data
Free Tier Limitations
- Two watchlists, two screens, and two custom dashboards.
- Two years of financials and one year of estimates; deeper history and research require an upgrade.
- Limited news and company snapshots. Intraday history and real-time coverage vary by instrument.
Check Koyfin’s current plan comparison for the tools relevant to your research. Its stock screener helps narrow a universe before you inspect individual charts.
3. Investing.com
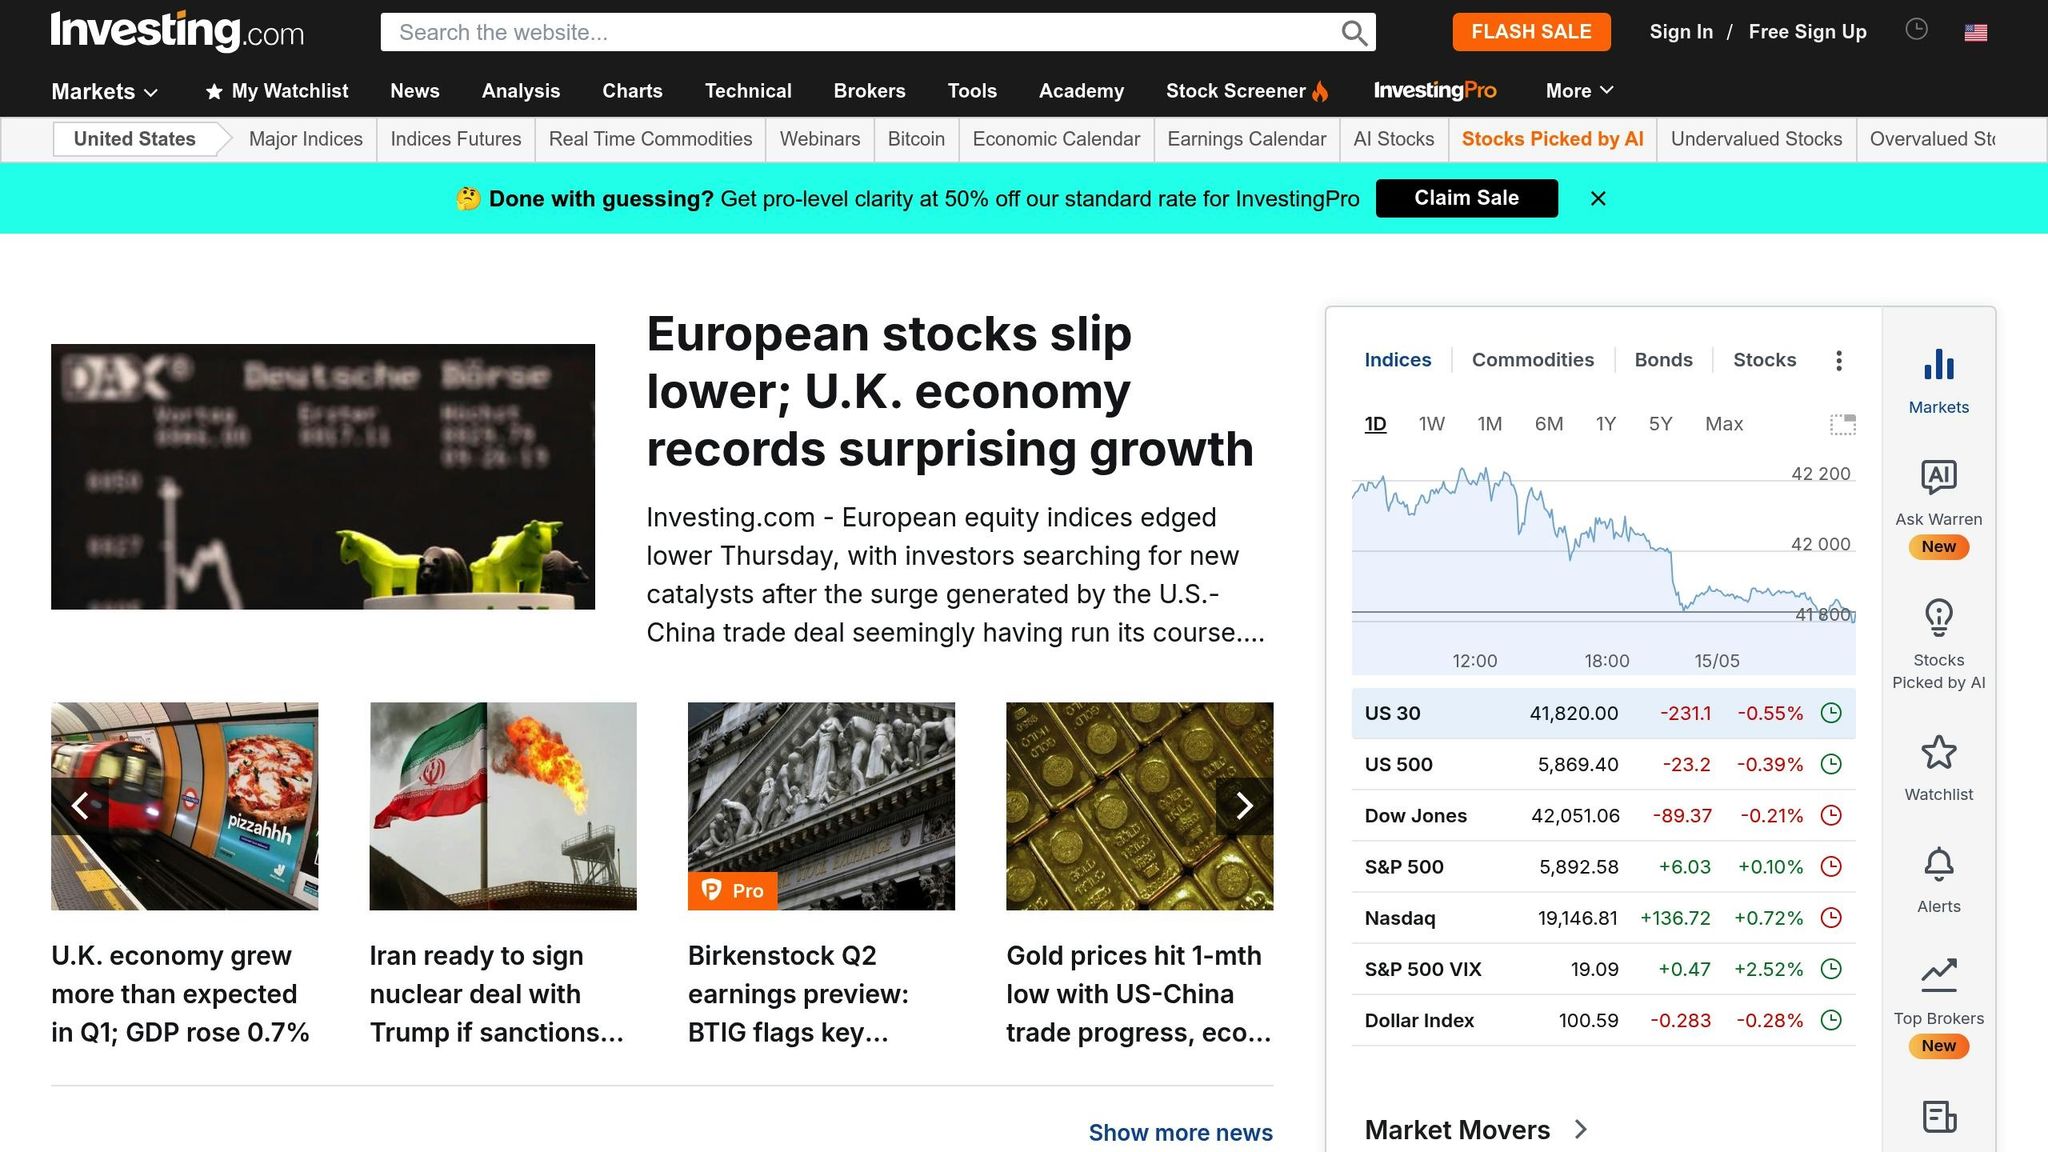
Investing.com provides a professional-grade charting platform designed for traders at all experience levels.
Charting Tools and Customization Options
| Feature Category | Available Tools |
|---|---|
| Chart Types | Candlestick, line, bar charts |
| Technical Analysis | Wide range of indicators and drawing tools |
| Customization | Flexible layouts, reusable templates |
| Comparison Tools | Multi-instrument overlays |
| Template Management | Save and reload configurations |
Real-time Data Availability
Investing.com offers interactive charts with indicators such as RSI, MACD, and Bollinger Bands. Data timing and whether a price is indicative depend on the instrument; check the chart’s feed before using a quote in a trading decision.
Asset Coverage
- Global stocks
- Indices
- Commodities
- Currencies
- ETFs
- Bonds
- Futures
Free Tier Limitations
- Limited historical data
- Feature availability varies by chart; use the interactive chart to check the studies you need
- Saving templates requires registration
4. StockCharts
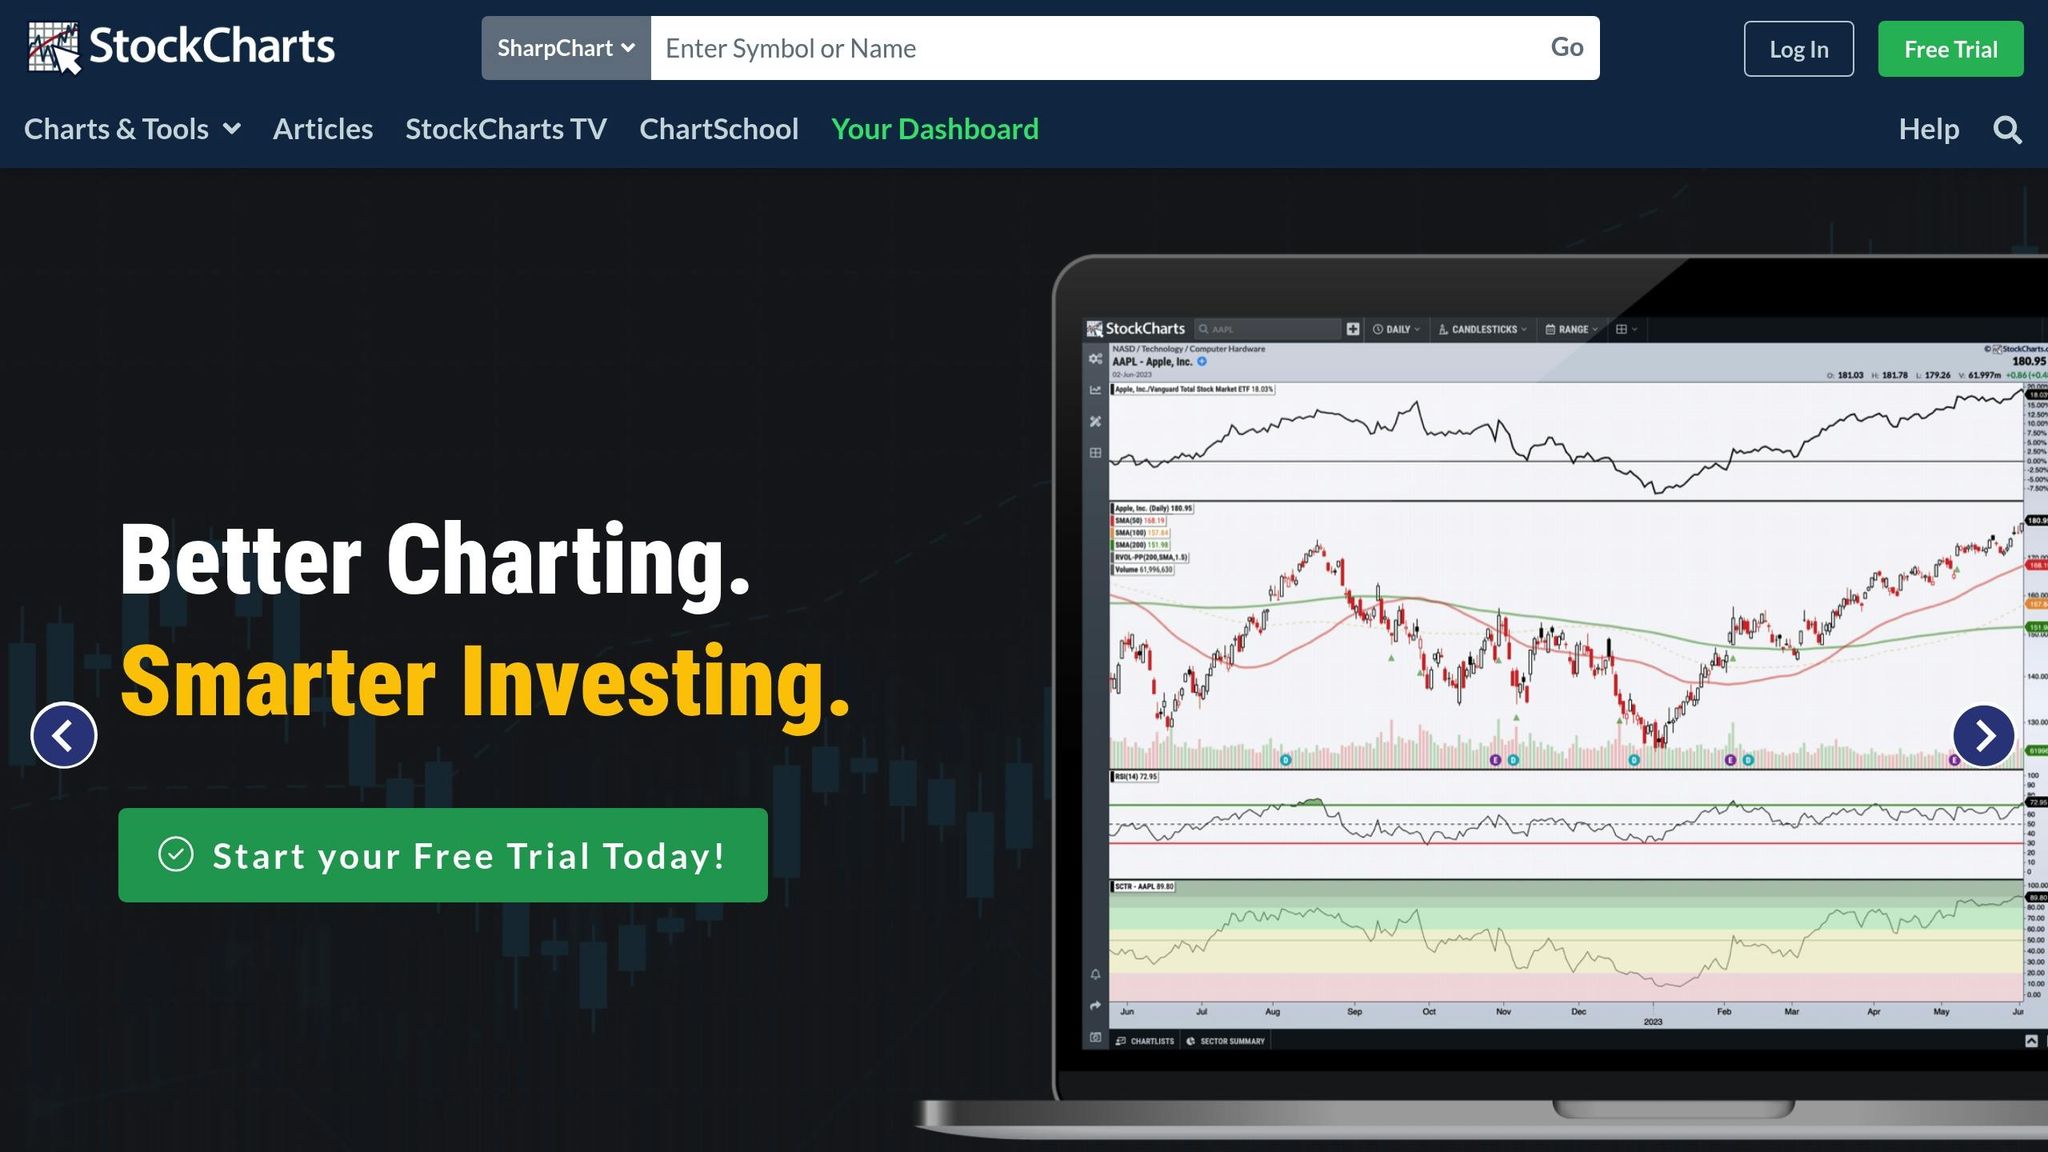
StockCharts provides traditional technical charting alongside its ChartSchool educational material. Its standout feature, SharpCharts, is especially useful for swing traders and long-term investors.
Charting Tools and Customization Options
| Feature Category | Free Tier Capabilities |
|---|---|
| Chart Types | OHLC Bar, Candlestick, Line charts |
| Time Frames | Daily and weekly bars |
| Technical Analysis | Up to 3 indicators and 3 overlays per chart |
| Chart Width | Max 900 px |
| Chart Settings | Basic symbol and period adjustments |
Real-time Data Availability
StockCharts’ free data plan includes limited BATS real-time data for popular U.S. stocks and delayed data for other markets. Its data FAQ explains that free U.S. real-time bars are not the official NYSE/Nasdaq feed and lack reliable volume information.
Asset Coverage
- U.S., Canadian, U.K., Indian stocks
- Cryptocurrencies
- Commodities
Free Tier Limitations
- Technical Analysis Constraints – limited to three indicators and three overlays per chart.
- Platform Restrictions – no intraday charts, saved settings, advanced scans, or auto-refresh.
Despite these limits, StockCharts is ideal for beginners focused on longer-term strategies. Its ChartSchool offers extensive education.
5. Finviz
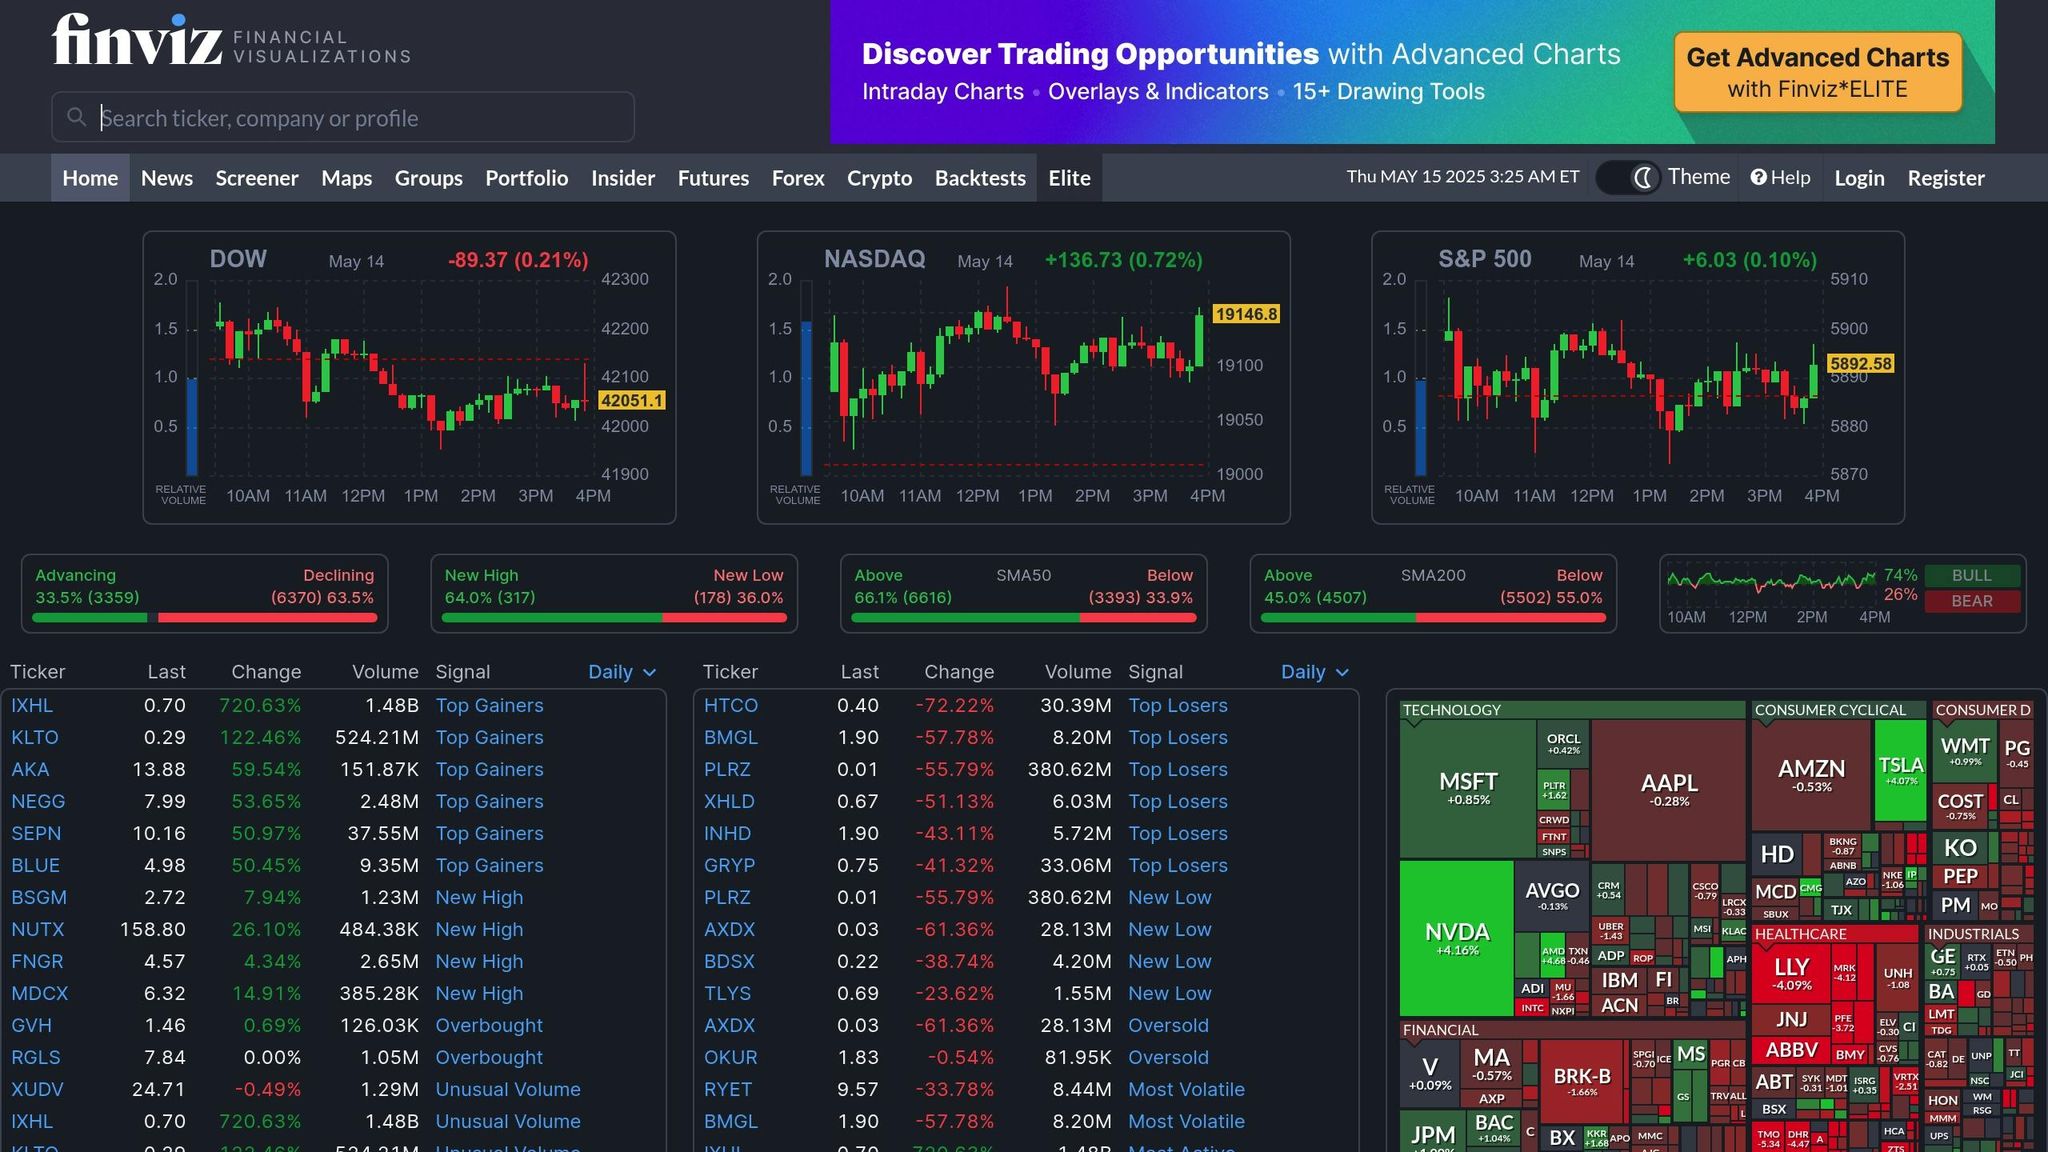
Finviz offers free charting tools tailored to traders analysing market trends and patterns.
Charting Tools and Customization Options
- Candlestick charts
- Pattern recognition (trendlines, wedges, triangles, channels)
- Setup detection (double tops/bottoms, head-and-shoulders)
- Range of indicators and overlays
Real-Time Data Availability
Finviz’s current FAQ lists a one-minute delay for regular U.S. stock quotes. Elite adds real-time stock quotes and extended-hours access. Futures remain delayed; check the displayed timestamp because delay descriptions differ between the FAQ and page footer. Market maps are useful for context, not an execution feed.
Asset Coverage
- U.S. stocks (NYSE, NASDAQ, AMEX)
- ETFs
- Forex pairs
- Futures contracts
- Cryptocurrencies
Free Tier Limitations
- Delayed data
- Ad-supported interface, basic charting
- Limited depth – Finviz Elite unlocks real-time features
6. GoCharting
GoCharting is a web-based platform packed with tools for charting and technical analysis.
Charting Tools and Customization Options
- Candlestick, Hollow Candlestick, Heikin Ashi, Renko
- Customisable backgrounds, watermarks, skins
- Draggable drawing toolbar that remembers position
- Advanced tools like Fixed Range Volume Profile
Real-time Data Availability
| Market | What to check |
|---|---|
| Crypto and CFD/forex | Live data is listed in the regional offering; verify the symbol and feed. |
| U.S. stocks | Check current Cboe coverage and the selected regional plan. |
| India NSE/BSE | The India Free plan lists end-of-day data; paid plans add real-time access. |
| CME futures | A separate market-data subscription or broker feed may be required. |
GoCharting’s regional plan comparison separates software, data, and advanced Orderflow. Check your region before relying on a price or feature limit.
Asset Coverage
- Cryptocurrencies
- Forex pairs
- U.S. equities
- Indian markets (NSE)
- CME Group futures
- ETFs
Free Tier Limitations
- Up to 2 charts per tab, 9,000 bars of history
- Data varies by market; NSE/BSE is end-of-day on the India Free plan
- 5 saved watchlists, 30 saved templates
- Limited options-chain depth; the India comparison places footprint/imbalance charts on Premium
7. MetaTrader 4/5
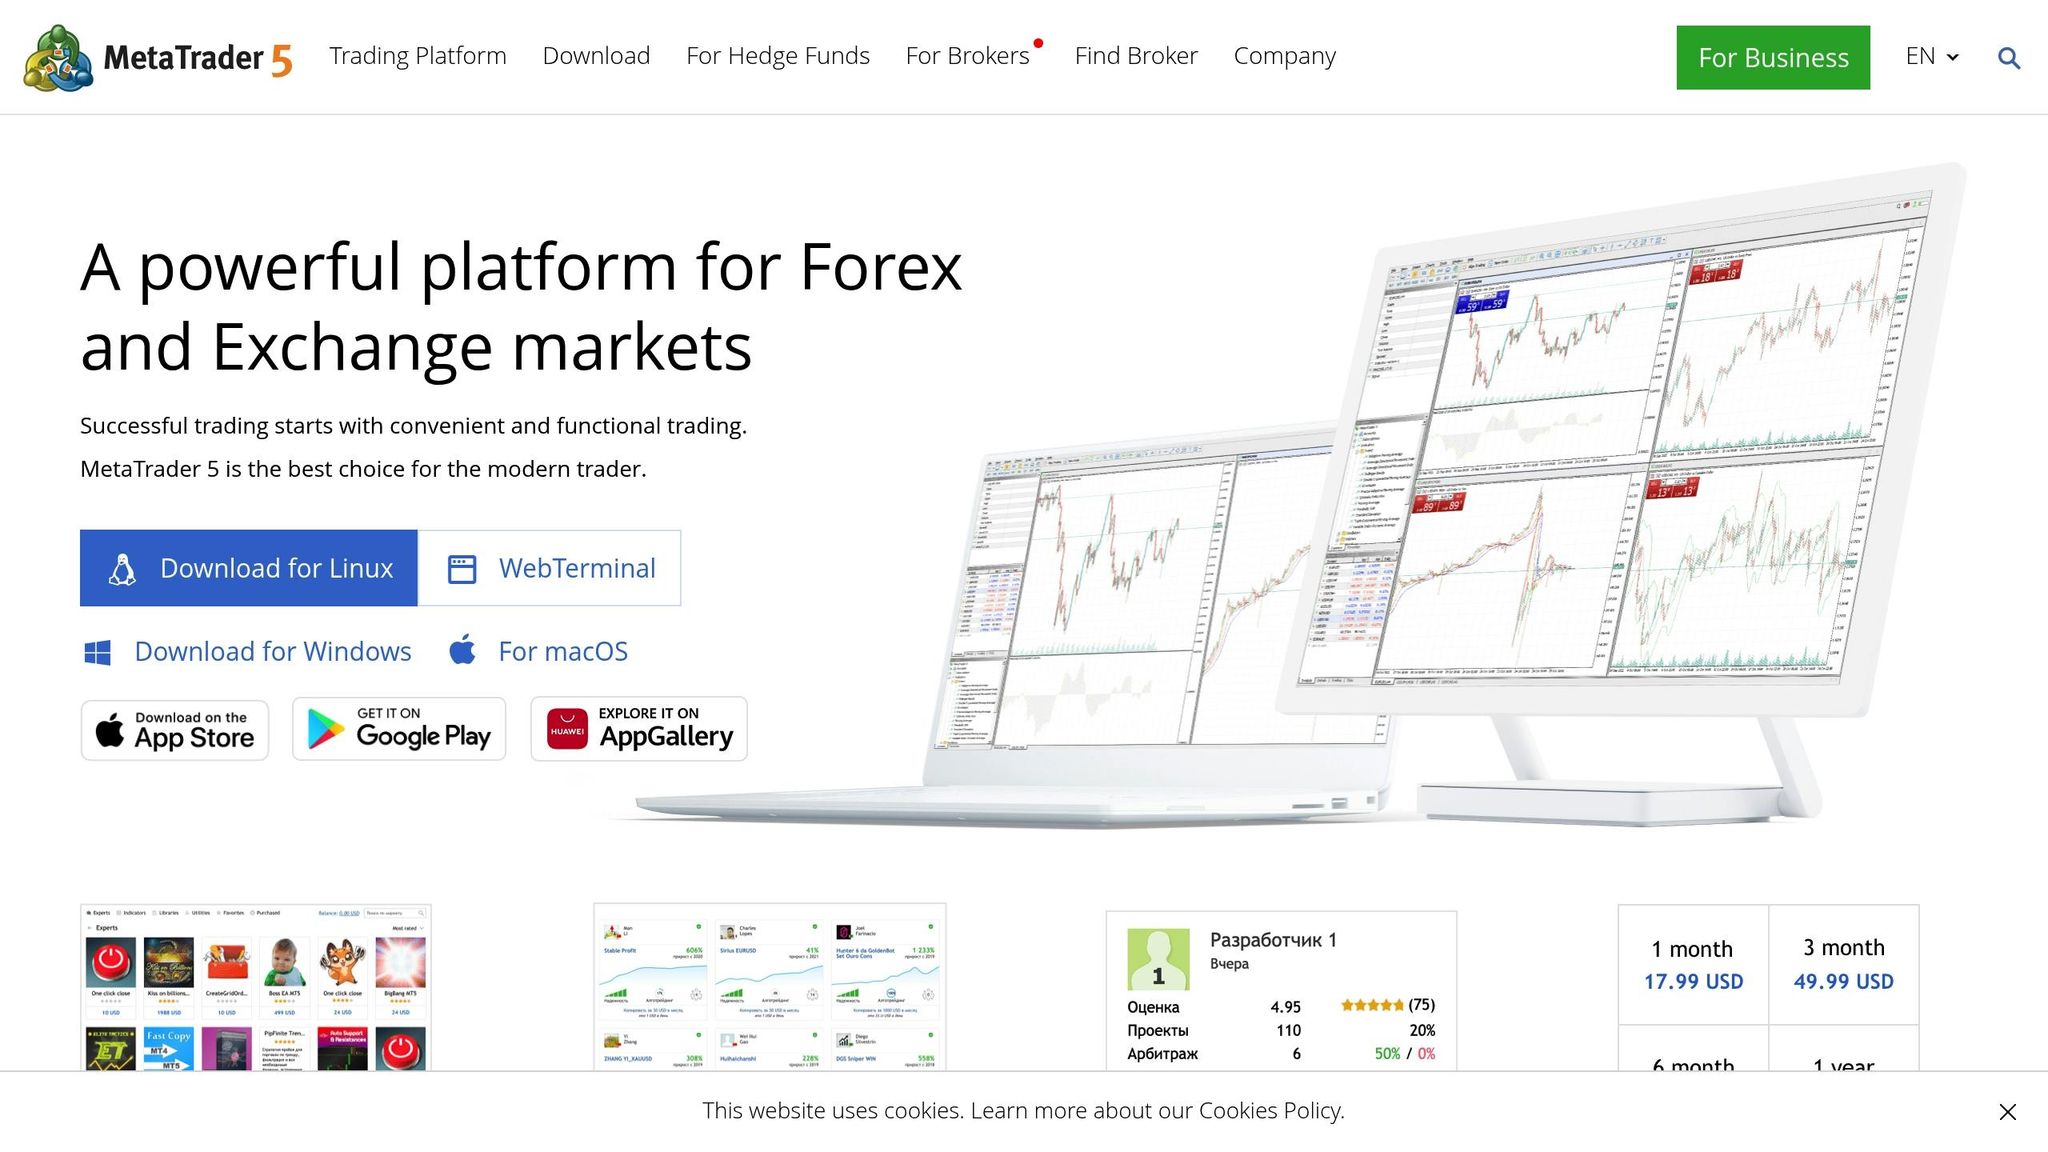
MetaTrader is widely regarded as a powerful charting solution for forex traders. Both MT4 and MT5 share a solid foundation of features.
Charting Tools and Customization Options
MT4 and MT5 are separate platforms, and desktop and web editions also differ. MT4’s familiar desktop set includes 30 built-in indicators, 24 analytical objects, and nine timeframes. MT5’s desktop technical-analysis tools expand that to 38 indicators, 44 objects, and 21 timeframes. Both support customizable charts and templates; custom studies are available through their respective code ecosystems.
Real-time Data Availability
MetaTrader delivers real-time data via partner brokers. MT5 adds Depth of Market and Level II pricing for order-book insight where the broker and instrument provide it.
Asset Coverage
| Asset Class | Availability |
|---|---|
| Forex pairs | Extensive |
| Stocks | Available on MT5 |
| Cryptocurrencies | Select pairs |
| Commodities | Major markets |
| Indices | Global |
Free Tier Considerations
- Platform is free, but broker account required
- Costs: spreads, commissions
- Support provided by brokers, not MetaQuotes
- Feature set varies by broker
8. ProRealTime Web
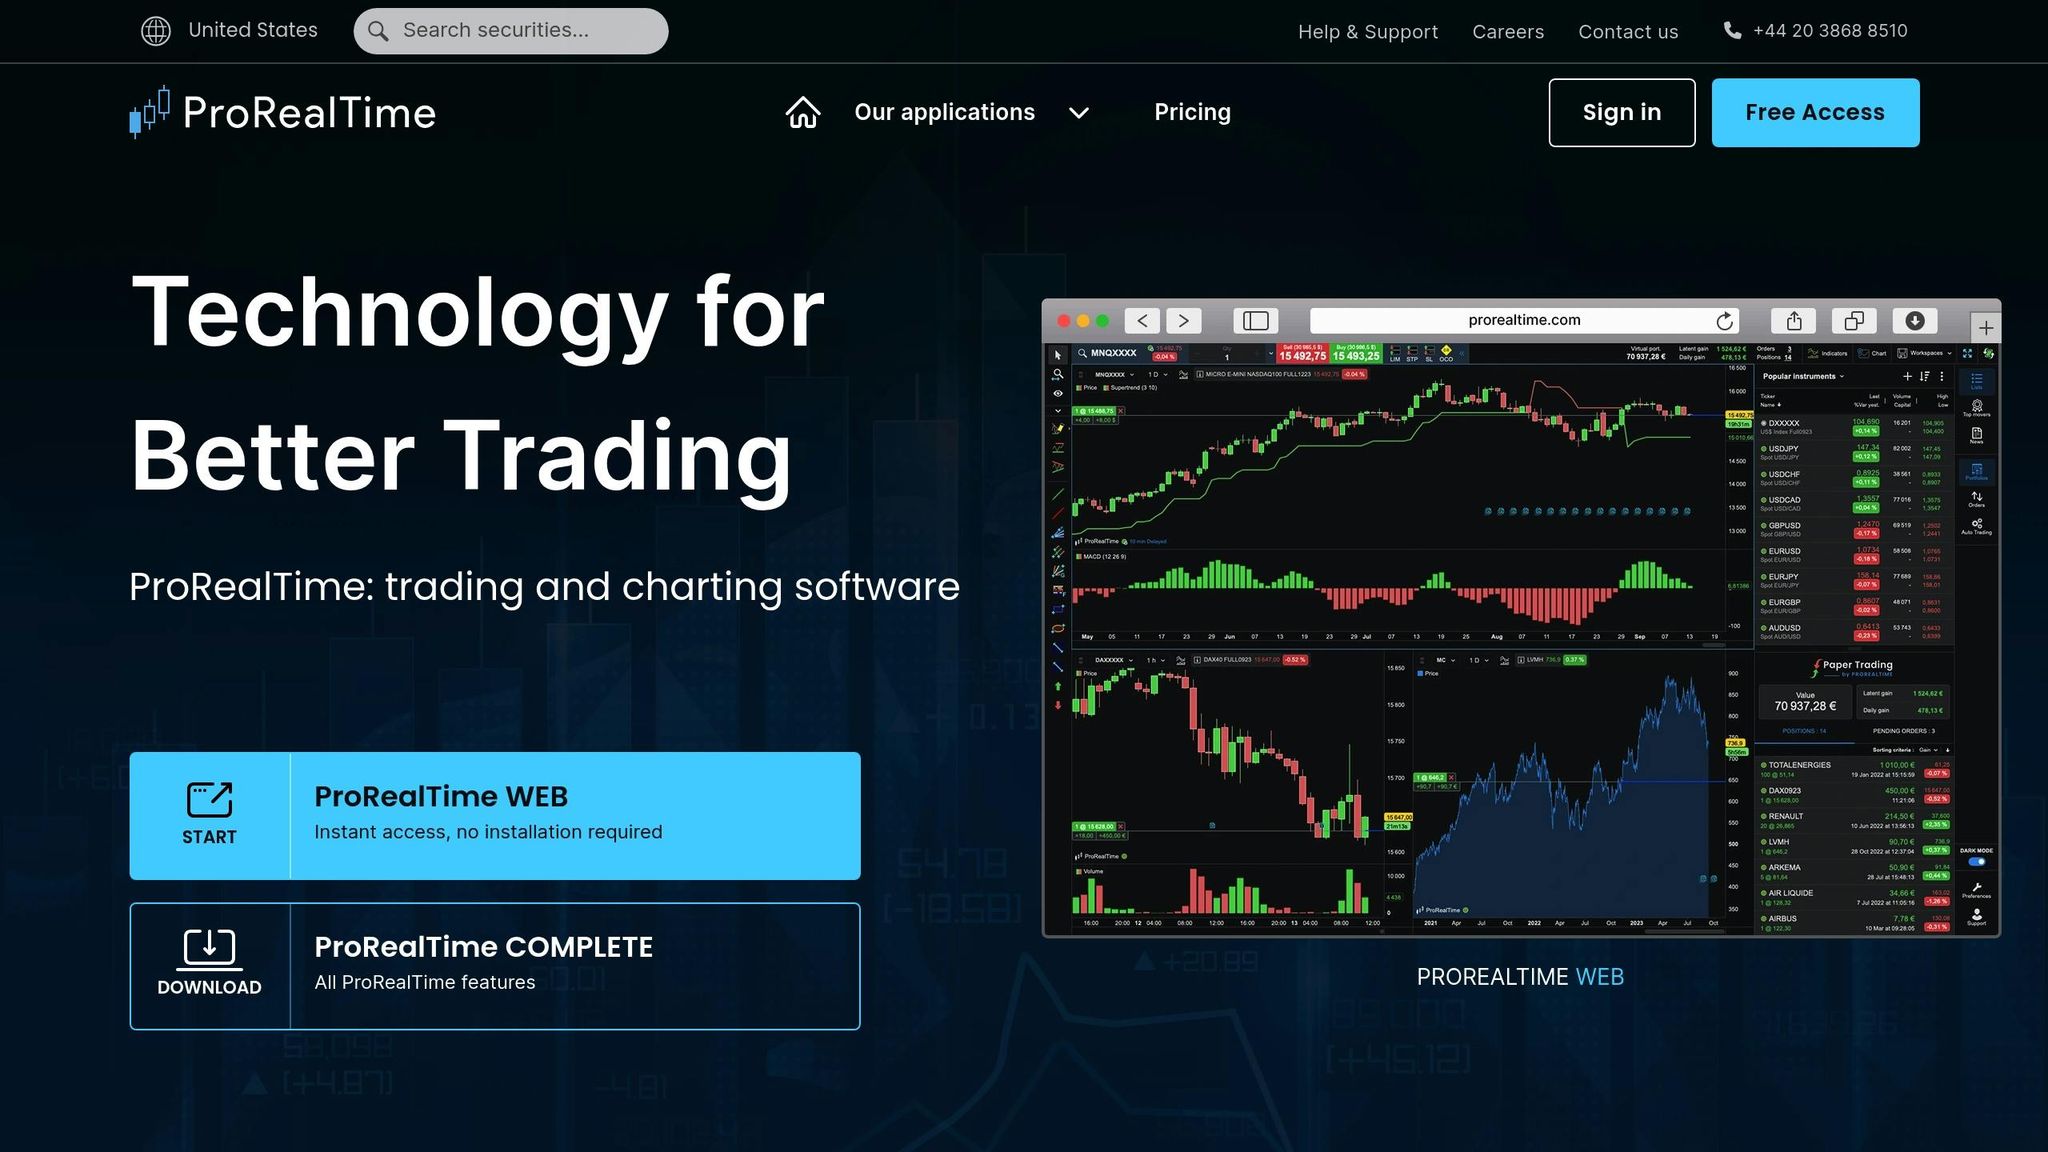
Charting Tools and Customization Options
ProRealTime Web supports browser-based technical charting. For advanced studies, its separate Complete application includes configurable indicator panels, drawing tools, custom indicators, scanners, and backtests. Confirm which edition contains the tools you need.
Real-Time Data and Asset Coverage
- Green circle – live quotes
- Blue on green – delayed quotes
- Gray – market closed
| Asset Class | Markets Covered |
|---|---|
| Traditional | Stocks, Futures, Options |
| Digital Assets | Cryptocurrencies |
| Currency Markets | Forex, Gold, Silver |
| Other Instruments | Commodities, Indices, Bonds |
Free Tier Limitations
ProRealTime describes Web as free with no ads. Advanced scanning, backtesting, automation, and multi-criteria alerts are promoted under its separate Complete application. Check the edition and data subscription you need; free charting and paid exchange data are different decisions.
Platform Features at a Glance
Core Features
| Platform | Charting focus | Key constraint |
|---|---|---|
| LuxAlgo | Quant Charts, native Orderflow, Library, coding and backtesting with Quant | 1 chart per tab; 5 tools plus Quant and volume; 500 monthly credits; 1-day Orderflow lookback |
| Koyfin | Financial and macro charts, research dashboards | 2 watchlists, 2 screens, 2 dashboards; deeper research requires an upgrade |
| Investing.com | Interactive charts and broad market coverage | Ads and instrument-specific data limitations |
| StockCharts | Daily/weekly technical charts and ChartSchool | 3 indicators and 3 overlays; no saved annotated charts |
| Finviz | U.S. stock screening and market maps | Real-time stock quotes and extended-hours features require Elite |
| GoCharting | Custom charts and Lipi scripting | Published India comparison: 2 charts/tab, 9,000 bars; advanced footprint charts require Premium |
| MetaTrader 4/5 | Charting, technical analysis, broker connection | Broker account, instruments, costs, and version determine the experience |
| ProRealTime Web | Free browser charting without ads | Advanced Complete features and exchange data must be checked separately |
Market Coverage
Coverage describes the platform’s available markets, not a promise that every market is free or real-time. LuxAlgo covers stocks, ETFs, crypto, forex, commodities, and futures, with access and data depth determined by the current plan and symbol. Its U.S. equities feed is exchange-specific.
Koyfin spans equities, macroeconomic series, currencies, and other financial data. Investing.com provides global instrument pages and charts. StockCharts emphasizes U.S. and selected international markets. Finviz’s stock screener covers NYSE, Nasdaq, and AMEX, with separate views for futures, forex, and crypto. GoCharting’s availability is regional and feed-dependent. MetaTrader’s markets come from the broker, while ProRealTime’s coverage depends on the chosen edition and exchange-data package.
Which Platform Fits Your Workflow?
| Your priority | Start with | Reason to compare another option |
|---|---|---|
| Custom study and strategy research in one charting workspace | LuxAlgo | Free is one chart per tab and AI usage is credit-limited. |
| Financial and macro research | Koyfin | Check depth and dashboard limits on Free. |
| Traditional chart study and education | StockCharts | Intraday charts and saving require membership. |
| U.S. stock screening | Finviz | Regular quotes are delayed. |
| Browser charts without ads | ProRealTime Web | Check advanced features against the Complete edition. |
| Multiple free chart cells and regional market tools | GoCharting | Orderflow and data entitlements vary by region and plan. |
| Broker-connected forex workflow | MetaTrader | Broker costs and platform edition matter. |
| Quick market reference | Investing.com | Check indicative prices and ads. |
These are use-case comparisons, not performance scores. A charting platform’s feature set cannot establish a trading strategy’s expected return.
Summary
LuxAlgo is our strongest choice for traders who want native charting, Orderflow, and a coding agent in the same workspace. Start with a supported market, add a Library study, and use Quant to define and test a specific rule. That is a practical step beyond viewing a chart, while keeping the historical evidence visible.
Specialist needs still matter. Koyfin suits financial-data research; Finviz helps narrow U.S. stocks; StockCharts supports traditional chart study; and MetaTrader can fit an existing broker workflow. Compare GoCharting and ProRealTime Web if layout flexibility or a different market-data package is your priority.
- Trading goals: which instruments, sessions, and research questions matter?
- Technical needs: drawings, indicators, custom code, backtests, or execution?
- Data access: which venue, delay, historical depth, and volume definition does the chart use?
Open Quant Charts free and try one clearly defined idea. Review the rules and costs before trusting a backtest. Backtesting is research, not prophecy.
FAQs
How do the free charting platforms compare in terms of real-time data availability?
A live quote is specific to a feed and instrument. LuxAlgo uses exchange-specific crypto feeds and Cboe EDGX for U.S. equities; live CME futures data requires a paid plan. StockCharts offers partial free U.S. real-time data, and regular Finviz stock quotes are delayed. Koyfin, Investing.com, GoCharting, ProRealTime, and broker-connected MetaTrader each require checking the instrument and data package.
Which free charting platform offers the best customization options?
LuxAlgo is a strong choice for creating a custom indicator or strategy through Quant, with drawing tools and Library studies on native charts. Koyfin focuses on financial-data visualization. GoCharting offers two chart cells per tab in its published India Free comparison. The right choice depends on whether you need custom logic, financial series, or simultaneous charts; LuxAlgo Free is limited to one chart per tab.
What are the main limitations of free charting platforms?
Common limits include tools per chart, simultaneous charts, saved layouts, historical bars, alert access, and exchange data. AI features can also have monthly usage limits. LuxAlgo Free includes 500 monthly credits and a one-day Orderflow lookback. Check the current plan and data source rather than assuming that free charting means unlimited research or real-time data for every market.
References
- Quant Charts: charting features
- Quant: the coding agent
- LuxAlgo: current plan limits
- Platform quickstart
- Charts and layouts
- Drawing tools
- Native indicator picker and Library
- Building strategies with Quant
- Backtest settings and results
- Orderflow: data and tool distinctions
- Charting platform announcement and product image
- Vela™: open-source charting engine core
- PineTS: open-source Pine Script® runtime
- Koyfin: plans
- Investing.com: interactive chart capabilities
- StockCharts: plan comparison
- StockCharts: free-data limitations
- Finviz: market coverage and quote delays
- GoCharting: regional plan comparison
- MetaTrader 4: technical-analysis tools
- MetaTrader 5: technical-analysis tools
- ProRealTime: editions and free Web offering
- ProRealTime Web and Complete distinctions
External Resources
Read next