Koyfin: Financial Analytics Review
Koyfin is built for financial research: company fundamentals, market dashboards, screening, and portfolio analysis. LuxAlgo brings charting and AI-assisted development together through Quant Charts and Quant, our coding agent. The choice depends on whether you need to understand businesses and portfolios or develop and inspect specific chart-based trading rules.
Both platforms can support an investment research process, but their tools are not interchangeable. This review compares current capabilities, subscription costs, and practical workflows, including where using them together makes sense. Features and standard prices were reviewed September 8, 2026; promotional offers are excluded.
Key Takeaways
- Koyfin suits fundamental research, cross-asset monitoring, and advisor portfolio reporting, with access determined by plan.
- LuxAlgo suits chart research, custom indicators, and strategy development with Quant.
- Koyfin Premium replaces the old Pro plan name. Annual equivalents differ from month-to-month rates, and paid access does not make every market feed real-time.
Quick Comparison
| Research task | Koyfin | LuxAlgo |
|---|---|---|
| Understand companies | Financial statements, estimates, filings, transcripts, and screening | Chart research with price tools and supporting Watchlist information |
| Monitor markets | Configurable dashboards, watchlists, and macro series | Quant Charts, multi-chart layouts, indicators, and workspaces |
| Develop trading rules | Research candidates and portfolio exposures | Generate and review indicator or strategy code with Quant |
| Analyze portfolios | My Portfolio; advisor plans add models, client portfolios, and reports | Strategy results and a separate trading journal serve different analytical tasks |
| Primary fit | Investors and advisors researching securities and portfolios | Traders studying charts and testing explicitly defined strategies |
2024 Koyfin Demo: Full Platform
This official Koyfin walkthrough, published November 22, 2024, demonstrates company research, charts, watchlists, screeners, portfolios, and dashboards. It remains useful for learning the workflow. Its interface and subscription references are historical; use the current pricing and feature distinctions below when choosing a plan.
1. Koyfin Tools and Services
Core Analytics Features
Koyfin combines company financials, analyst estimates, valuation data, filings, transcripts, and news with price charts and market views. Its feature overview also covers ETF research, economic and earnings calendars, and portfolio tools. This makes it useful for connecting a company-specific question with broader market conditions.
For example, examine whether revenue and margins are improving, compare the company with peers, and then study its price performance against a benchmark. Keep reported results separate from analyst forecasts: estimates can change and should not be presented as realized earnings. Long historical charts do not imply that every fundamental field or security has the same history.
Screening and Dashboard Customization
The My Screens guide explains how to select regions, exchanges, sectors, and filter ranges. Results can be sorted, saved to a watchlist, or exported. Specify the measurement period and units for each field before comparing companies; a valuation filter alone does not establish that a stock is inexpensive relative to its risks.
Example: start with a defined U.S. equity universe, add a liquidity threshold and positive operating profitability, then compare valuation and revenue growth within a sector. Inspect several matching companies to understand why they passed. This is a research shortlist, not a recommendation or a backtest of an investable historical strategy.
With My Dashboards, begin with a template or blank workspace and arrange watchlists, charts, and news. Linked widgets can update together when you select a symbol. A useful layout might combine a company watchlist, a historical chart, a benchmark comparison, and relevant headlines. Keep comparison dates consistent and distinguish normalized price performance from a valuation ratio.
Data Coverage and Timing
Koyfin’s data overview covers equities, ETFs, mutual funds, currencies, selected futures, government yields, and macroeconomic series. Availability, historical depth, and update frequency vary by dataset. Mutual-fund access is currently an advisor-plan feature; a broad coverage list does not mean all data is included in every subscription.
Its data-timing FAQ specifies a mix of live and 15-minute-delayed U.S. stock data, 15-minute-delayed Canadian stocks, and end-of-day data for other countries. Check the symbol’s timing information in the dashboard or quote box. Upgrading to Premium does not universally remove exchange delays.
Portfolio Analysis and Advisor Workflows
My Portfolio supports holdings research, while Premium adds advanced portfolio analytics. Koyfin’s plan comparison separates these investor tools from Advisor Core and Advisor Pro capabilities, including model portfolios, client portfolios, proposals, reports, and custodian connections. Portfolio-level performance analysis answers different questions from a simulation of individual strategy entries and exits.
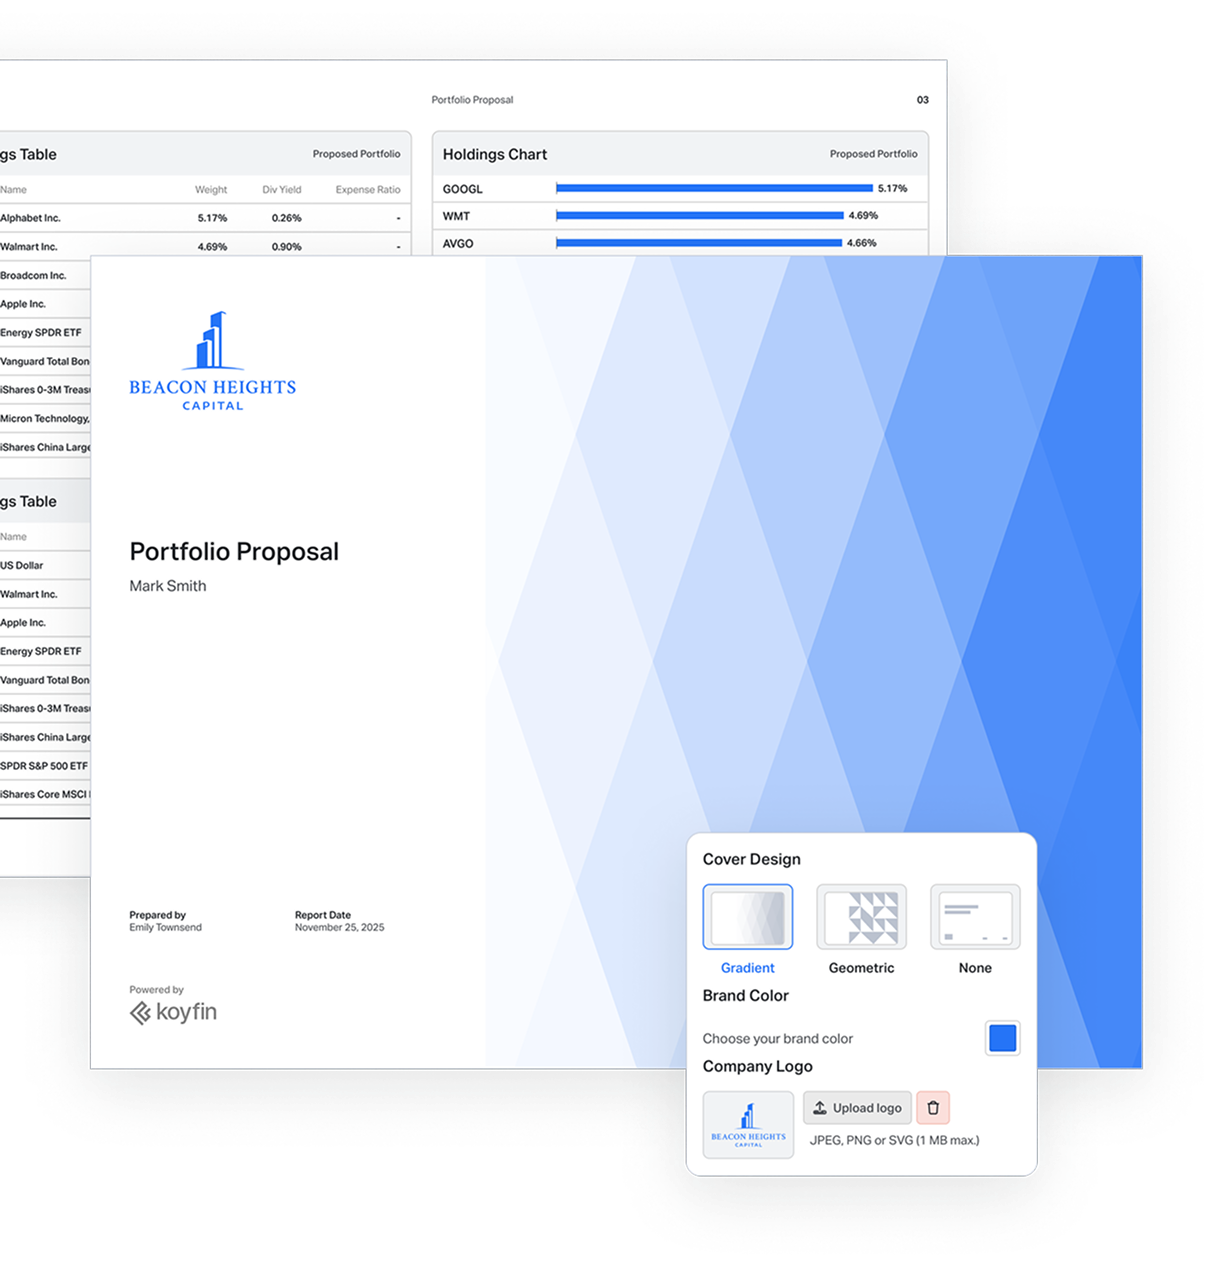
The Schwab advisor integration requires a signed data-access agreement and setup. It imports current holdings, not transaction history. Advisor Core includes one custodian connection; Advisor Pro supports multiple connections and additional portfolio-management integrations. Do not assume a connection recreates every historical trade or enables order execution.
Koyfin documents nightly synchronization for connected accounts, with manual sync also available. Integrated accounts are read-only in Koyfin, and newly available accounts can be imported automatically. Check the last-updated timestamp before preparing a client report, particularly after an account change or transfer.
Subscription Tiers and Features
The current Koyfin pricing page lists the following U.S. dollar rates. Annual equivalents require annual billing; they are not the price of a cancellable monthly subscription.
| Koyfin plan | Monthly billing | Per month with annual billing | Selected capabilities |
|---|---|---|---|
| Free | $0 | $0 | Two watchlists, screens, and dashboards; two years of financials and one year of estimates |
| Plus | $49 | $39 | Ten years of financials and estimates; unlimited watchlists, screens, and dashboards |
| Premium | $110 | $79 | Advanced My Portfolio analytics, custom data/formulas, and financial templates |
| Advisor Core | $239 | $209 | Models, client portfolios, mutual funds, one custodian, and 10 reports/proposals monthly |
| Advisor Pro | $349 | $299 | Multiple integrations, custom report pages, and 200 reports/proposals monthly |
Older articles may call the $79 annual-equivalent tier “Pro”; the current name is Premium. Advisor features and report limits have also changed. Review the full comparison for limits and renewal terms, especially if multiple users, custodian connections, or client reports are central to your work.
2. LuxAlgo Tools and Services
Quant Charts and Custom Strategy Research
LuxAlgo’s Quant Charts provides a browser-based workspace for studying markets, using drawing tools and indicators, and arranging multiple charts. The Watchlist helps organize symbols and includes an advanced view with supporting financial and news information. This chart-centered workflow is distinct from Koyfin’s broader company and advisor research environment.
Use Quant, our coding agent to develop an indicator or strategy from a specific idea. Describe the conditions, review the generated script in Code, sign in, and click Run on the intended chart. An indicator displays calculations; simulated strategy trades require explicit entry, exit, and risk rules.
Example research task: ask Quant for a daily strategy that enters after the close exceeds the highest high of the previous 20 completed bars and exits after the close falls below the lowest low of the previous 10 completed bars. Exclude the current bar from both lookbacks. Specify position size, costs, and order-fill assumptions, then inspect several trades against those rules before judging the summary.
The strategy viewer includes performance statistics and a Trades Log for reviewing simulated outcomes. Use standard price bars, account for commission and slippage, and test a separate period from the one used to develop the idea. Historical profitability does not establish future returns, particularly when parameters have been repeatedly adjusted.
Library Tools and Advanced Analysis
The Library adds hundreds of LuxAlgo tools to a Quant Chart in one click: market structure, order blocks, liquidity, trend, momentum and money flow. They scan the tickers you choose rather than reproducing Koyfin’s broad fundamental stock universe, and Quant can turn any of them into a strategy and backtest it against years of history.
Integration, Education, and Support
LuxAlgo runs in the browser; check the entitlements of your plan instead of assuming one plan includes every feature. The documentation hub and indicator Library provide setup guidance and explanations; tutorials and community discussions can help with learning, but do not validate a strategy’s expected returns.
Subscription Plans and Pricing
The LuxAlgo pricing page displays these standard rates. Temporary introductory discounts are excluded, and annual equivalents require paying for the year.
| LuxAlgo plan | Standard monthly billing | Standard annual total | Annual equivalent / month |
|---|---|---|---|
| Free | $0 | $0 | $0 |
| Premium | $67.99 | $479.88 | $39.99 |
| Ultimate | $119.99 | $719.88 | $59.99 |
| Ultra | $229.99 | $1,439.88 | $119.99 |
Free includes a limited Quant allowance and chart access. Paid plans increase credits and platform limits such as chart layouts and history. Compare the features you actually need, renewal pricing, and any separate data costs.
Direct Comparison
A Combined Research Workflow
An investor could research company fundamentals in Koyfin, save a shortlist, and manually add selected symbols to a LuxAlgo Watchlist. Chart analysis can then address a different question, such as how a clearly defined breakout rule behaved. This is a manual workflow, not a documented automatic connection between the services.
Keep the evidence separate: running a price strategy on today’s shortlist does not reproduce the results of a historical fundamental selection process. A proper historical universe study needs the companies and information available at each decision date, including delisted securities where relevant. Also check symbol mapping, exchange, data timing, and price adjustments before comparing charts.
Best Uses and Recommendations
- For long-term investors: Koyfin is a strong fit for company research, peer comparisons, asset monitoring, and portfolio context. Start by checking whether the free limits are sufficient.
- For financial advisors: evaluate Koyfin’s advisor plans against your custodian, reporting volume, model-portfolio needs, and required history. Test an actual reporting workflow before relying on it for clients.
- For active traders: LuxAlgo is a strong fit when chart analysis needs to lead into custom indicators or explicitly testable strategies with Quant. Review code and simulated trades as part of that process.
- For either platform: compare a concrete task, the data it requires, and the total subscription cost. More features or a higher tier do not by themselves produce better investment decisions.
References
Read next