MarketSmith Alternatives: 5 Stock Screeners Compared
The best MarketSmith alternative depends on what you need to replace: fundamental screening, intraday alerts, chart analysis, or a repeatable research workflow. FINVIZ, Stock Rover, TradingView, Trade Ideas, and LuxAlgo solve different parts of that process. A large filter library alone does not tell you whether a tool fits your market, timeframe, and budget.
First, a naming clarification: IBD rebranded MarketSmith as MarketSurge in March 2024. Meanwhile, marketsmith.com now announces a new MarketSmith expected in 2027. This comparison addresses alternatives to the stock research workflow associated with the older name; it does not treat that future product as available today or quote the old $149.95 price as a current offer. MarketSmith India is a separate regional offering.
Product details were checked September 8, 2026. The recommendations below reflect documented capabilities and workflow fit, not a controlled performance benchmark or independently verified trading returns. LuxAlgo is a strong choice when your priority is moving from a stock idea into chart research and editable strategy development with Quant, our coding agent.
Quick Comparison: Five MarketSmith Alternatives
| Platform | Best fit | Current monthly billing | Key boundary |
|---|---|---|---|
| FINVIZ | Fast US stock filtering and visual review | Free; Elite $39.50 | Free stock quotes are delayed; screening does not establish a profitable strategy |
| Stock Rover | Fundamental ranking and portfolio research | Premium $34; Premium Plus $70; Ultimate $99; Ultimate Pro $199 | Metrics, historical depth, ranking, and screening capacity vary by plan |
| TradingView | Charting, global market tools, and Pine screening | Free; displayed paid plans $14.95–$239.95 | Specialized screeners and chart features differ; exchange data can cost extra |
| Trade Ideas | Intraday stock alerts and configurable scans | Core $127; Apex $254 | AI and backtesting are Apex features; alerts are not guaranteed trade outcomes |
| LuxAlgo | Native charts, AI research, custom strategies, and selected-symbol toolkit screens | Free; Premium $67.99; Ultimate $119.99; Ultra $229.99 | Native chart and Quant workflows differ from the 10-ticker TradingView toolkit screeners |
These are US-dollar prices shown during the review, before taxes and add-ons. Annual subscriptions often have lower monthly equivalents but require a different payment commitment. TradingView labels its displayed prices as special prices; confirm your eligibility and renewal terms. A free account or trial does not necessarily include every feature discussed below.
What to Compare Before Switching
- Filters: check fundamental definitions, technical conditions, custom formulas, and whether multiple conditions are combined as intended. EPS growth over the same quarter last year differs from sequential quarter growth.
- Data: separate quote delay, refresh frequency, exchange coverage, and the update schedule for company fundamentals. A frequently refreshing table can still use delayed prices.
- Interface: test saved screens, chart views, watchlists, exports, alerts, and how quickly you can inspect why a symbol matched.
- Price: include the needed plan, data feeds, add-ons, renewal rate, and annual commitment. Pay for a recurring research need rather than a larger feature count.
- Coverage: verify the exact exchange, security type, and historical universe. A platform that charts many asset classes may use separate screeners with different fields.
1. FINVIZ: Efficient US Stock Screening
FINVIZ works well for reducing a broad US stock universe to a manageable list. Its descriptive, fundamental, and technical filters make it useful for swing-trading research, valuation comparisons, and reviewing market movers. The compact tables and chart views suit a process that starts with a few defined criteria and then examines individual candidates.
Filters and Practical Uses
| Filter group | Examples | What to check |
|---|---|---|
| Valuation and quality | P/E, forward P/E, PEG, price/book, return on equity, debt/equity | A low multiple can reflect deteriorating expectations; compare similar businesses |
| Growth | Quarterly EPS and sales growth, longer-term growth fields | Use the stated comparison period and verify company reports |
| Technical and liquidity | Moving averages, RSI, relative volume, average volume, ATR, beta | Market capitalization is not liquidity; volatility and trading cost are different measures |
| Ownership and activity | Institutional ownership, insider activity, short float, gainers and losers | Reported positions can lag; high short interest does not guarantee a squeeze |
For example, a swing-trading research screen might combine a minimum average-volume requirement, positive sales growth, and price above a moving average. Those criteria define a candidate list, not an entry rule. Review the chart, upcoming earnings, spread, and the reason for the price move before deciding whether the stock deserves further study.
Presets, Charts, and Elite Pricing
FINVIZ now supports a more connected saved-screen workflow: save a screen, rename or edit it, open results in chart views, and use flags or portfolios to organize follow-up research. The official saved-screen guide explains the current controls. Keep the screen definition with your notes so a later result can be compared with the same criteria.
The Elite page lists $39.50 for monthly billing or $299.50 annually, equivalent to about $24.96 per month. It advertises real-time data and enhanced screening, alerts, exports, and chart tools. The current FAQ describes a one-minute delay for free stock quotes; do not apply the old blanket 15-minute stock delay or assume that futures and fundamental fields update identically.
The current Elite feature list should guide a purchase. Do not subscribe on the assumption that an older mention of backtesting guarantees a currently included strategy-testing workflow. Test the specific capability you need during the trial, and review billing terms before starting a paid subscription.
Video: Save and Reuse a FINVIZ Screen
This official FINVIZ tutorial, published April 30, 2026, demonstrates saving, sharing, and managing stock screens. Its roughly 38-second format is useful for turning a one-off search into a repeatable workflow. Example symbols and screen names are demonstrations, not trade recommendations.
2. Stock Rover: Fundamental Ranking and Portfolio Research
Stock Rover is a strong fit for investors comparing business quality, valuation, dividends, ETFs, and portfolio exposures. It combines screening with company research and portfolio tools, making it useful when the next question after finding a stock is how that business compares with peers or fits existing holdings.
Its current screening page describes prebuilt strategies, custom criteria, historical equations, ranked results, and scoring of portfolios or watchlists. A simple filter includes or excludes a company; a ranked screen orders candidates using selected factors and weights. Neither a high rank nor a familiar investing framework proves future outperformance.
Current AI Screening and Plan Boundaries
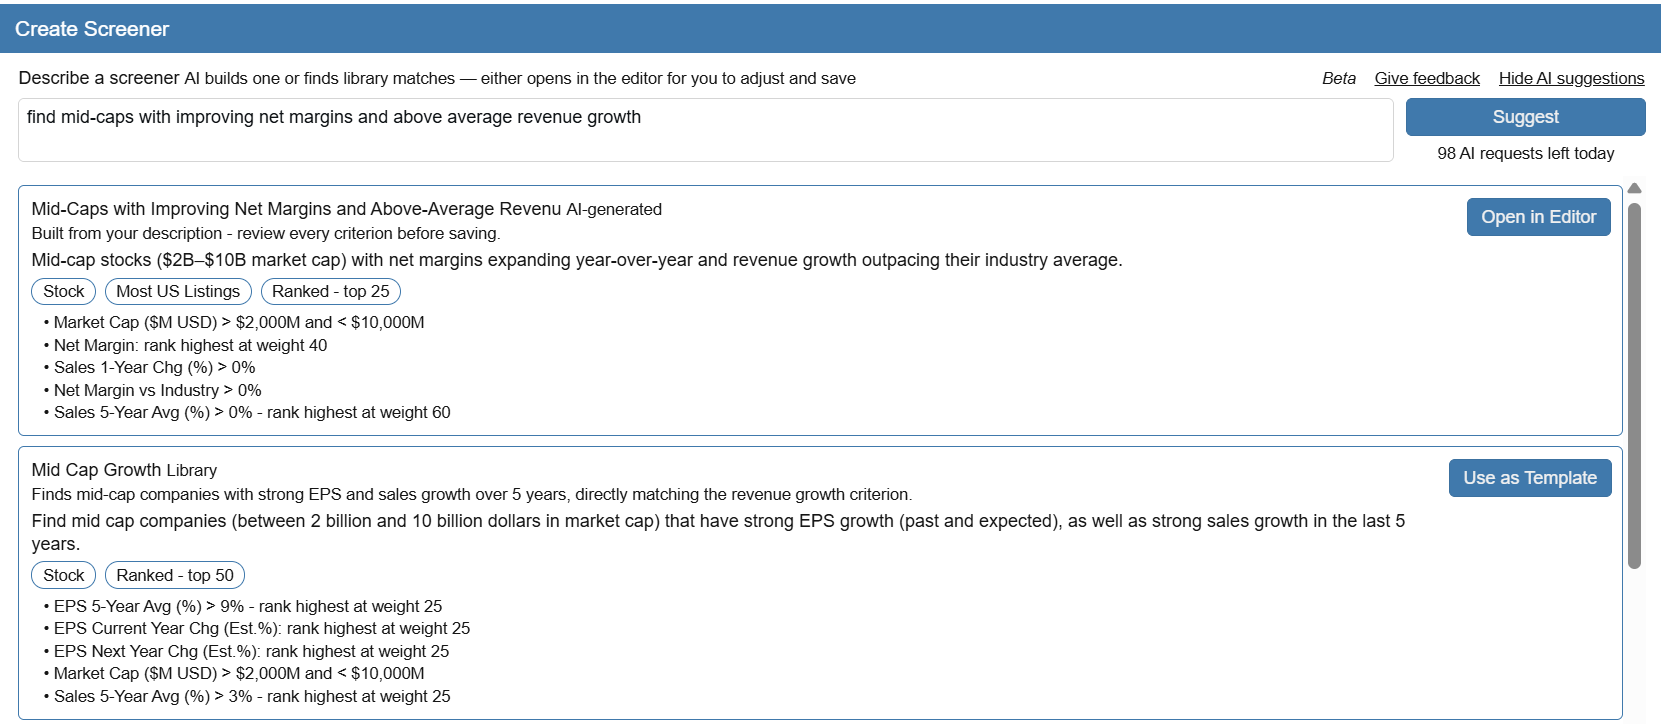
Stock Rover also describes AI-assisted screener creation: enter the characteristics you want, inspect suggested library screens or generated criteria, then review and adjust the result in the editor before running it. Check the metric definitions and weights rather than assuming the request was translated exactly.
The current plan lineup has changed substantially from the older Essentials/Premium/Premium Plus pricing in many reviews. The monthly options shown during this review are:
| Plan | Monthly price | Relevant research capabilities |
|---|---|---|
| Premium | $34 | 400+ metrics, screening across 300+ metrics, five years of fundamentals, portfolio tools |
| Premium Plus | $70 | 700+ metrics, ten years of fundamentals, historical/equation and ranked screening, advanced ETF screening, custom metrics |
| Ultimate | $99 | 800+ metrics, twenty years of fundamentals, percentile screening, additional OTC coverage, expanded fund and options research |
| Ultimate Pro | $199 | Expanded screening, result-row, brokerage-connection, and export capacity |
Premium’s coverage lists roughly 8,500 stocks, 7,000-plus ETFs, and 40,000-plus funds. The screening page’s broader 14,000-plus-stock headline includes coverage beyond that base; Ultimate adds approximately 6,000 OTC tickers. Avoid combining the largest universe, deepest history, and every metric into a claim about the lowest-priced plan. Annual and two-year offers have separate terms.
How to Use the Fundamental Depth
A quality-and-value study can start with profitability, balance-sheet measures, valuation, and a defined growth period. Dividend research should consider payout sustainability and business conditions as well as yield. For ETF comparisons, inspect holdings overlap, costs, and exposure rather than ranking solely on a trailing return.
Prebuilt screens can introduce approaches such as quality scoring or growth selection, but a generic implementation is not necessarily identical to IBD’s proprietary ratings or MarketSurge methodology. Review the actual criteria. Historical screen snapshots also differ from a full trading simulation: reliable performance analysis must account for the universe and information available at each date, rebalancing, delistings, and trading costs.
3. TradingView: Charts and Programmable Screening
TradingView combines interactive charts, technical tools, alerts, Pine Script, and market-specific screeners. It suits traders who want to inspect a candidate visually and develop custom technical conditions in the same broader platform. Its broad chart coverage should not be confused with one universal screener containing every field for stocks, crypto, forex, and commodities.
Standard Screeners and Pine Screener Are Different
TradingView provides separate stock, ETF, bond, and crypto screening tools. Use the tool appropriate to the instrument and verify the available filters. Chart pattern features, community scripts, a chart watchlist, and the dedicated Pine Screener are also distinct capabilities.
The current Pine Screener guide supports scanning a selected watchlist or major index using an eligible indicator. The indicator can be custom-written, built in, or drawn from the community library. Third-party community screeners can have their own symbol limits; those limits should not be confused with the dedicated Pine Screener.
- Select one source and one indicator per screen. Index sources support up to 4,000 symbols; watchlist capacity depends on the account.
- Use supported plotted values or alert conditions to define filters and display results. Strategies, profiles, patterns, and the Financials category are not supported as selected Pine Screener studies.
- Supported intervals are 1, 5, 15, and 30 minutes; 1, 2, and 4 hours; and daily, weekly, or monthly. Custom intervals are not supported in this tool.
- The calculation uses the latest 500 bars, and scripts have specific request and input restrictions. Rerun the scan after changing the source, indicator, inputs, timeframe, or filters.
These limits matter when a script needs long historical context or particular inputs. A successful chart indicator does not automatically behave identically inside the screener, and a current screening result is not a historical strategy backtest. Check the generated values against a few individual charts before relying on the output.
Pricing, Alerts, and Data
The pricing page displayed monthly-billed Essential at $14.95, Plus at $34.95, Premium at $69.95, and Ultimate at $239.95, alongside free Basic access. Annual billing showed lower equivalents. The page labels the displayed rates as special prices, so confirm the actual offer and renewal cost for your account.
Choose around the required screener access, alert limits, watchlist capacity, chart layouts, and history. A paid subscription does not automatically include every exchange’s real-time feed. Review market-data coverage and professional-user eligibility separately. Community popularity or an unsourced user rating is not a measure of screening accuracy.
4. Trade Ideas: Intraday Alerts and Stock Scans
Trade Ideas is worth evaluating when your main task is finding intraday stock events and configuring alerts around a defined trading process. It offers streaming alert windows, ranked lists, chart tools, and plan-specific AI and backtesting capabilities. Its value depends on whether the output is relevant and usable, not on the number of alerts produced.
Understand the Alert Logic
In an Alert Window, selected alert types use OR logic while filters constrain which events qualify. For example, selecting two alert types generally does not mean both events must happen simultaneously. The official Alert Selection guide explains this distinction and the special Heartbeat alert.
A Top List Window is different: it ranks matching stocks and refreshes approximately every 30 seconds. Do not describe every window as a tick-by-tick streaming alert. Saved configurations and custom filters can make research repeatable, but the exact trigger, session, symbol universe, and feed must be checked.
Holly, TI Wave, and Money Machine are separately named AI-related workflows. Avoid treating these tools as a single universal system that continuously adapts to every market condition or guarantees a success rate above 60%. No such independently validated result is established here.
Pricing and Testing Limits
Current Trade Ideas pricing is Core at $127 monthly or $1,068 annually, and Apex at $254 monthly or $2,136 annually. The annual equivalents are $89 and $178 per month. Apex includes the AI and backtesting capabilities shown on the plan page; the older $99/$188 and $5,500 package comparison is not the current core lineup.
The OddsMaker guide describes important simulation limits, including minute-level testing and exclusions such as current-day and extended-hours testing. Historical alerts and simulated fills are not proof of live execution quality. Include applicable costs and evaluate a complete sample, including losing and missed opportunities.
Broker integration is a separate decision. Confirm the supported broker API, account eligibility, order controls, and the exact automation workflow before assuming a scanner can place trades. Test with a small, defined alert set and record relevance, noise, latency, and feasible entry prices during the trial.
5. LuxAlgo: From Stock Ideas to Chart Research with Quant
LuxAlgo is a charting and AI platform for investigating markets, developing indicators and strategies, and reviewing trading activity. Its strongest role in this comparison is helping you move beyond a list of matching tickers: inspect the chart, make the research question explicit, and use Quant, our coding agent, to develop an editable implementation.
Organize Candidates on Native Charts
Use a LuxAlgo Watchlist to organize the markets you are investigating, then select a symbol to examine its chart. The advanced watchlist provides a broader table view and related information. Confirm the intended exchange and data source when moving a candidate from another screener; similar ticker labels can refer to different instruments.

The chart-data guide documents supported markets, history limits, and data sources. Exchange-specific stock volume is not automatically consolidated market volume. A tool’s ability to display an instrument also does not establish that every historical test has sufficient data.
Develop an Explicit Test with Quant
Suppose a screen identifies liquid stocks with positive growth and price strength. You can ask Quant to create a strategy for a selected stock that tests an entry when a completed bar closes above the highest high of the previous 20 completed bars, excluding the current bar from that threshold. Specify the intended timeframe, position size, exit rule, and adjustable parameters.
Open Code, inspect the implementation, and click Run using the documented Quant strategy workflow. Review individual simulated trades, then set relevant Inputs and Properties such as commission and slippage. A plotted indicator is not automatically a trading strategy. Keep a later evaluation period separate and investigate how results change with costs and nearby parameter values.
That price-rule experiment does not reconstruct the original fundamental screen historically. Testing a growth-and-breakout selection process needs point-in-time fundamentals and a historical universe, including companies that later disappeared. Screening today’s survivors and backtesting their charts would answer a different, biased question. Quant’s editable output helps make assumptions inspectable; it does not remove the need to validate the data and design.
Use the integrated LuxAlgo Journal to review recorded trading activity and the decisions behind it. Keep the screen definition, observation date, planned entry, and actual execution in your research notes so you can distinguish a good selection process from one favorable outcome.
LuxAlgo Pricing
| Plan | Monthly billing | Annual total | Annual equivalent per month |
|---|---|---|---|
| Free | $0 | $0 | $0 |
| Premium | $67.99 | $479.88 | $39.99 |
| Ultimate | $119.99 | $719.88 | $59.99 |
| Ultra | $229.99 | $1,439.88 | $119.99 |
These standard LuxAlgo prices exclude temporary introductory offers. Free includes 500 monthly credits; paid tiers increase the Quant allowance and other limits. The old $39.99/$59.99/$119.99 figures were annual equivalents, not monthly-payment prices, and the current highest tier is Ultra. Compare exact entitlements before choosing a plan.
Which Alternative Fits Your Trading Style?
| Primary need | Tool to evaluate first | Why it fits | What to verify |
|---|---|---|---|
| Low-cost swing-trading research | FINVIZ | Quick fundamental/technical filtering and visual candidate review | Quote delay, saved-screen access, earnings context, and actual liquidity |
| Long-term stock or dividend selection | Stock Rover | Fundamental depth, ranked screening, and portfolio research | Plan-specific metrics, historical definitions, overlap, and valuation assumptions |
| Charting across markets and custom Pine screens | TradingView | Specialized screeners, charts, and programmable indicator conditions | Data fees, Pine Screener limits, and required plan features |
| Intraday event alerts | Trade Ideas | Configurable streaming alerts and ranked stock lists | OR/AND logic, session coverage, alert noise, and executable prices |
| Chart research and editable strategy development | LuxAlgo | Native charts, Quant, Watchlists, and Journal | Data sufficiency, explicit strategy rules, and separation from TradingView toolkit screens |
You do not need an “institutional” trading style to use LuxAlgo. Start with the research task and the required access. A fundamental screener plus LuxAlgo chart research can be complementary, but two subscriptions should solve two clear needs. None of these alternatives should be assumed to reproduce every proprietary IBD rating, pattern, educational resource, or workflow exactly.
A Practical Way to Compare the Tools
Choose one universe and one research question, then use the same definitions across trials. Save the filter settings and the time of each run. Inspect a sample of matches and nonmatches to determine whether differences come from coverage, delayed data, field definitions, or genuinely different conditions.
- Measure how long it takes to create, save, rerun, and review a useful screen. Do not count every returned ticker as a successful idea.
- Check whether an earnings release, missing fundamental field, corporate action, or exchange mismatch changes the result.
- Evaluate signal quality with a defined observation window and complete records. A selected winning example or vendor win-rate claim is not a comparative test.
- Calculate the ongoing subscription and data cost, then choose the smallest setup that reliably supports the process.
For broad filtering, begin with the screener best matched to the asset and criteria. When the next task is understanding the chart or testing an explicit price rule, LuxAlgo provides a focused path through native charts and Quant. Keep screening, historical simulation, and actual execution as separate steps that each require verification.
FAQs
What features should I compare when choosing a stock screener alternative to MarketSmith?
Compare the supported markets, filter definitions, quote delay, refresh frequency, saved screens, custom conditions, chart tools, and total subscription cost. Check the exact plan and data entitlements. A candidate list is not a backtested strategy or a guarantee of trading success.
Which MarketSmith alternatives offer free access?
FINVIZ, TradingView, and LuxAlgo offer free access with limits. Paid subscriptions add different capabilities, and a trial may temporarily expose features absent from a free account. Review the current plan page and required data feeds before comparing costs.
How do I choose the right screening platform for my trading style?
Evaluate FINVIZ for efficient US stock filtering, Stock Rover for fundamental and portfolio research, TradingView for charting and Pine screening, and Trade Ideas for intraday alerts. LuxAlgo is a strong fit for taking candidates into native chart research and editable strategies with Quant. Choose around the task and verify each tool’s limits.
References
Read next