TC2000: Stock Screener Review
TC2000 is three things sold together: a charting and screening application for US stocks and options that has been in the market for more than twenty-five years, a scanning engine called EasyScan with its own formula language, and an affiliated brokerage that routes orders from the same screens. This review sets out what each subscription tier includes at current prices, how the condition editor and Personal Criteria Formulas actually work, what the brokerage charges, and what a screener can and cannot tell you. It closes with where Quant Charts, LuxAlgo's charting and AI platform, fits: it has no market-wide scanner, but its watchlist, Library indicators and Quant, the coding agent that writes and backtests a rule in Pine Script, cover the step a screener leaves out, which is finding out whether the condition you are scanning for has ever made money.
Key points:
- Scanning is a paid-tier feature. The Basic plan is charts, watchlists, news and paper trading; real-time scanning, the EasyScan wizard and formulas start at Premium.
- Software and brokerage are separate companies. TC2000 Software Company sells the subscription; TC2000 Brokerage, a FINRA member, executes orders, and a brokerage account can discount the software.
- A condition is a Boolean. Every EasyScan filter, wizard-built or written as a formula, resolves to true or false per symbol and becomes a watchlist column.
- A scan finds candidates; it does not validate a rule. Test the condition's historical edge before you trade its output.
What TC2000 Is
The features overview describes a platform that combines charting, stock and option screening and trading, running on Windows, Mac, iOS, Android and the web. A free mode with delayed streaming data, all US stocks and options, option chains, trading windows and a favourites watchlist can be used without giving a name or card, and the former FreeStockCharts service has been folded into it. Charting extends to options: option charts plot against the underlying with bid-ask or last-trade data, and the stock's price is shaded where the option is in the money. Orders include limit, bracket with profit target and stop, one-cancels-another and multi-leg, and paper accounts are unlimited, so a strategy can be rehearsed on real-time data before capital is involved.
Plans and Prices
The pricing page lists three tiers as of September 2026, billed monthly, annually with two months free, or biennially with six months free, under a thirty-day money-back guarantee. The comparison table on the same page still labels the upper tiers Gold and Platinum in places; the features overview calls them Basic, Premium and Premium+.
| Tier | Monthly price | What it includes |
|---|---|---|
| Basic | $24.99 | Real-time US stocks (NYSE, Amex, Nasdaq) via Nasdaq Basic, stock and option charting, live streaming watchlists, custom layouts, MT Newswires real-time news, paper trading with limit orders from chart trendlines |
| Premium | $49.99 | Basic plus real-time scanning and sorting from indicators, formulas and chart data, most watched and trending stocks, morning pre-buzz for unusual pre-market activity, chart drawing tools, the EasyScan wizard, Personal Criteria Formulas, column stacking and grouping, multi-monitor layouts, history columns for past scans, and 100 alerts |
| Premium+ | $99.99 | Premium plus real-time market-pulse gauges and indicators that count how many stocks on a list meet a condition, live auto-refreshing filters and sorts, intraday performance columns, unweighted price indexes for watchlists, and 1,000 alerts |
Optional data is billed monthly on top: real-time US indexes and real-time US options at $9.99 each, Dow Jones delayed at $1.50 or real-time at $2.50, consolidated tape at $14.99, and extra alert blocks at $10 for 100 or $25 for 500. Two footnotes matter. The streaming scan tools that run on TC2000's servers are limited to five running at once, with more purchasable as data feeds; and a brokerage account earns a $25 discount on the software for every month in which you place a trade or hold more than $30,000, up to $300 a year.
How EasyScan and Formulas Work
The screening model is simpler than the marketing suggests, and understanding it makes the platform much easier to use. Every scan condition is a Boolean, true or false for each symbol at the current bar, and every condition becomes a True/False column in a watchlist that can then be filtered and sorted. The help site describes the two ways to build one. In the condition editor, click Add Condition and choose from the EasyScan condition library, a large set of pre-built conditions such as price crossing up through a moving average, or step through the wizard that lets you pick indicators from the library or from your chart and set the comparison. Or click Write Formula and express the condition in the Personal Criteria Formula language directly.
The formula documentation is explicit that condition formulas convert indicator formulas and numbers into Boolean results by comparing them with relational operators, so the close being above the open is simply C > O, and more elaborate conditions combine such comparisons with AND, OR and time offsets. Conditions can also feed indicators: Premium+ can plot the count of stocks meeting a condition as a market-pulse gauge or a historical indicator, which turns any Boolean into a breadth measure. The history columns on Premium show what a scan would have returned at a past point, a small feature that matters more than most, because it lets you see how many of last month's candidates went anywhere.
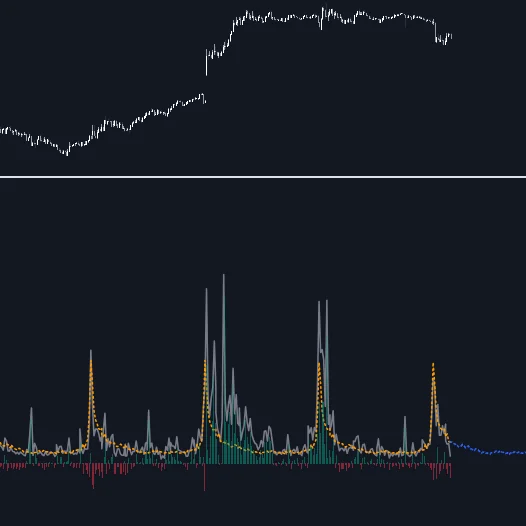
A practical note on the conditions themselves. The relative volume entry in the Library explains why raw volume is a poor scan input and volume relative to its own recent norm a better one: a symbol trading twice its average at 10 a.m. is unusual, a symbol trading its average is not, whatever the absolute number. The same logic applies to every condition you write. Compare a symbol to itself, not to the universe, unless the universe comparison is the point.
The Brokerage
TC2000 Brokerage is a separate company from the software business, affiliated through common ownership, registered as a broker-dealer and a FINRA and SIPC member, per the help site's disclosure. The brokerage page says orders route through Interactive Brokers' SmartRouting, and the integration is the selling point: limit and stop orders can be dragged around the chart, attached to trendlines, and managed in windows that behave like watchlists, with step-to-market orders that try for a better price and profit-and-loss zones for choosing multi-leg option strategies. Commissions, from the commissions page, come in two plans.
| Plan | Stocks and ETFs | Options | Examples |
|---|---|---|---|
| Small Trader Plan (default) | $1 plus $0.005 per share | $1 plus 65 cents per contract | 100 shares $1.50; 200 shares $2.00; 1 contract $1.65; 5 contracts $4.25 |
| Active Trader Plan (optional) | $5 plus $0.001 per share | $5 plus 35 cents per contract | 12,000 shares $17; 20,000 shares $25; 50 contracts $22.50; 200 contracts $75 |
The Active Trader Plan is described as suited to traders who typically trade more than a thousand shares or ten contracts at a time, which is the arithmetic to run before switching: at 300 shares a trade the default plan costs $2.50 and the active plan $5.30. Margin rates and cash interest are listed on the same page and change with rates, so check them rather than a review.
What a Screener Can and Cannot Tell You
A screener answers one question well: which symbols meet this condition right now. It answers a second question badly, and most losses from screening come from confusing the two. The second question is whether symbols that meet the condition go on to do anything useful, and a live scan cannot answer it, because the list you see is the survivors of today's condition, not the outcomes of yesterday's. TC2000's history columns help by showing past results, but a proper answer needs the condition coded as an entry rule and run across years of bars, with exits and costs, which is a backtest rather than a scan.
Three habits follow. Write the condition once, in words, before building it, so the scan tests a hypothesis rather than fishing. Keep the condition count low; each additional filter shrinks the list and raises the odds that what remains is an accident of that day. And treat the scan's output as a watchlist to study on the chart, not as a signal, which is where the next section begins.
Where Quant Charts Fits
Quant Charts does not scan the market. Its Panels currently hold one panel, the Watchlist, and the platform is built for studying and testing symbols you have already chosen, so a trader who needs a live, market-wide condition scan will run it elsewhere and bring the names across. What the Watchlist then offers is the study surface a scan output needs: lists saved with the workspace and synced to the account, one click to load a symbol on the active chart, and an Advanced view with Price, Financials and News tabs, so a scan's candidates can be sorted by market cap, sector, 52-week range, revenue growth, earnings per share or price-to-earnings, grouped by sector or exchange, arranged into your own sections, and read against a headline feed filtered to the list, with an allocation donut by asset class and sector exposure for the equities on it. Free plans get two lists of ten symbols; the paid plans are unlimited lists.

The step a screener cannot do is the one Quant does. Take the condition you scan for, say a close above the fifty-day average on volume at twice its twenty-day average, and describe it to Quant in plain language as an entry rule with a stop and an exit. Quant writes the Pine Script as a strategy, you inspect it under Code and click Run on a symbol the scan produced, and the Backtest Summary reports net profit, trade count, win rate, maximum drawdown and profit factor across the chart's history, with commission and slippage set in the strategy Properties so the result is costed. Run it on a handful of the scan's names and on a few it rejected. If the condition's edge is real, it shows in the summaries; if the summaries are flat, the scan is finding stocks that look right and do nothing, which is the commonest outcome and the one worth knowing before the first order. Library indicators load in a click for the exploratory reading, and starred ones stay in Favorites across reloads.
Where Each Tool Stops
TC2000 stops at execution: it scans, charts and, through its affiliated brokerage, routes orders for US stocks and options. Quant Charts stops at research and record: the Watchlist, the Library, Quant's strategies and the Backtest Summary, the Journal for logging, and no order routing at all, because the LuxAlgo platform does not place orders for you.
Conclusion
TC2000 is a mature, honest product: a fast scanner built on a simple Boolean model, charting that handles options as well as stocks, and a brokerage whose main argument is that orders live on the same screens as the analysis. Its prices are clear and its tiers are drawn where the value is, with scanning starting at Premium and the market-breadth tools at Premium+. Its limit is the limit of every screener: it tells you what matches, not what works. Bring the matches to Quant Charts, study them in a watchlist that carries financials and news, have Quant write the condition as a strategy and read the Backtest Summary with costs, and the scan becomes the first step of a tested process rather than the whole of it.
Key Takeaways
- TC2000 tiers are $24.99, $49.99 and $99.99 a month; real-time scanning, the EasyScan wizard and formulas start at Premium.
- Every condition is a true/false test per symbol, built in the wizard or written as a Personal Criteria Formula, and shown as a watchlist column.
- The brokerage is a separate FINRA-member company routing through Interactive Brokers, with $1 plus $0.005 per share as the default stock commission.
- A scan lists what matches now; whether the condition has an edge needs a costed backtest.
- On Quant Charts, hold scan results in a watchlist with financials and news, and have Quant backtest the condition with commission and slippage set.
FAQs
What is TC2000?
TC2000 is a charting, screening and trading platform for US stocks and options, available on Windows, Mac, mobile and the web, with a free delayed-data mode. Its EasyScan engine filters watchlists by true/false conditions, and an affiliated brokerage, TC2000 Brokerage, executes orders from the same charts.
How much does TC2000 cost?
As of September 2026 the tiers are Basic at $24.99, Premium at $49.99 and Premium+ at $99.99 per month, with two months free on annual billing and six on biennial, and a thirty-day money-back guarantee. Optional feeds such as real-time indexes or options add $9.99 each, and a brokerage account can discount the software by $25 in qualifying months.
How does EasyScan work?
Each condition is a Boolean that resolves to true or false for every symbol and appears as a True/False column in a watchlist. You build conditions from the EasyScan library, through a step-by-step wizard that picks indicators from the library or your chart, or by writing a Personal Criteria Formula such as C > O for a close above the open.
What does TC2000 Brokerage charge?
The default Small Trader Plan is $1 plus $0.005 per share for stocks and ETFs and $1 plus 65 cents per contract for options. The optional Active Trader Plan is $5 plus $0.001 per share and $5 plus 35 cents per contract, aimed at trades above a thousand shares or ten contracts. Orders route through Interactive Brokers' SmartRouting.
Can Quant Charts scan the market like TC2000?
No. Quant Charts has no market-wide scanner; its Panels hold the Watchlist. It is where scan results are studied and tested: the Watchlist's Advanced view adds financials, news, grouping and allocation, Library indicators load in a click, and Quant writes the scan condition as a strategy so the Backtest Summary can show whether it has an edge.
How do I test whether a scan condition works?
Describe the condition to Quant as an entry rule with a stop and an exit, inspect the Pine Script under Code, click Run on symbols the scan produced, and read net profit, trade count, win rate, maximum drawdown and profit factor with commission and slippage set in Properties. Flat summaries across several names mean the scan finds matches without an edge.
References
LuxAlgo Resources
- Quant Charts
- Panels
- Watchlist
- Watchlist Advanced view: Price, Financials, News
- Quant: making strategies and the Backtest Summary
- Library concept: relative volume
- Library: Volume Surprise
External Resources
Read next