TipRanks: Market Insight Review

TipRanks is a research platform built on one idea: anyone who publishes an opinion about a stock can be scored on what happened next. It calls itself a financial accountability engine, uses machine learning and natural-language processing to collect analyst ratings, blogger calls, hedge-fund filings and insider transactions, and has measured their results since January 2009, publishing track records for more than 96,000 experts. This review explains how those rankings and the analyst consensus are actually computed, what the Smart Score is and what TipRanks' own disclaimer says about its performance claims, what the Premium and Ultimate plans include at the prices shown in September 2026, and where Quant Charts, LuxAlgo's charting and AI platform, fits: it carries no analyst or insider datasets, but its Watchlist holds the financials and news for the names TipRanks surfaces, its Library explains how to read expert and sentiment data, and Quant, the coding agent, can backtest the technical half of any idea.
Key points:
- The rankings have a published method. Star Ranking combines an expert's success rate and average return and weights the result by how many ratings it rests on.
- The consensus is arithmetic. Buy, Hold and Sell ratings over three months are scored 1, 3 and 5 and averaged into five bands with fixed thresholds.
- Smart Score performance is backtested. TipRanks' own disclaimer says so and lists the limits; read any outperformance figure with that in mind.
- Two paid tiers, promotional pricing. Premium and Ultimate were listed at $30 and $50 a month, shown at a 55% discount, with a 30-day money-back guarantee.
What TipRanks Measures
The about page frames the problem plainly: retail investors follow expert recommendations online without knowing anything about the expert, so TipRanks tracks and measures the performance of Wall Street analysts, financial bloggers, hedge funds and corporate insiders and makes the results public. The FAQ describes the mechanism. Natural-language processing monitors reputable websites for new ratings on US-listed stocks; most appear on the site as soon as they are picked up, and a handful are held for manual review by a data validation team. The performance record runs back to January 2009. The company also sells the same datasets to financial institutions through an enterprise arm, which is worth knowing because it means the ratings database is the product and the consumer site is one window onto it.
How Experts Are Ranked
The FAQ states that the Star Ranking was developed with the Cornell Finance Department and incorporates every rating since January 2009. It combines two measures, an expert's success rate, the share of ratings that produced a positive return, and average return per rating, with success rate secondary to the ability to generate positive returns, and then applies a Z test so that a record built on many ratings counts for more than the same numbers built on few. Top Analysts are those in the top 20 to 30 percent of all analysts by that ranking. The measurement rules matter as much as the formula. A Buy rating is measured for one year unless the analyst downgrades to Hold within that time, in which case the Hold closes the position and nothing after it is counted; a Sell closes any open Buy and opens a short. Returns are measured with no benchmark by default, so any move in the stock counts as the analyst's gain or loss, and the user can switch the benchmark to the matching sector SPDR fund or the S&P 500, after which a rating that rose less than its benchmark is scored as a loss.
The consensus shown at the top of each stock page is simpler still. Ratings from the last three months are scored Buy 1, Hold 3, Sell 5 and averaged, and the average falls into one of five bands.
| Average score | Consensus label | Note |
|---|---|---|
| 1.5 or less | Strong Buy | Requires at least three ratings in the window; with one or two it is shown as Moderate Buy |
| Above 1.5 to 2.5 | Moderate Buy | |
| Above 2.5 to 3.5 | Hold | |
| Above 3.5 to 4.5 | Moderate Sell | |
| Above 4.5 | Strong Sell | Same three-rating minimum as Strong Buy |
Premium members can switch this to a Top Analyst Consensus that counts only ratings from the best-performing analysts, which is the more interesting number, because a Strong Buy from forty analysts of average record and a Strong Buy from six who rank in the top fifth are different pieces of evidence. The Library's analyst revision breadth entry adds the complementary reading: across a universe, the balance of upward and downward estimate changes tends to be more informative than the level of the ratings themselves, so a consensus that is improving matters more than one that is merely high.
Insiders, Funds and the Smart Score
TipRanks defines corporate insiders as executives, board members and holders of more than 10 percent of a company's shares, who must report their trades to the SEC within two working days, and it splits their transactions into informative and uninformative. An uninformative buy is stock received as compensation; an uninformative sell is an option exercise near expiry or the cashing of shares granted as pay; informative trades are deliberate, and only those are treated as a vote of confidence. That distinction is exactly the one the Library's insider transactions entry draws, with the added point that insiders sell for many reasons and buy for one, so open-market purchases, and clusters of them by several insiders, carry the weight. Hedge-fund activity comes from quarterly holdings filings, which means it is at least six weeks old when it appears, and blogger and individual-investor sentiment come from the platform's own tracking of published opinions and user portfolios.
The Smart Score rolls these datasets into a single 1 to 10 rating per stock, drawing on the inputs the plans page lists under stock analysis: analyst forecasts, blogger opinions, insider and hedge-fund activity, individual investor sentiment, news sentiment, technical analysis and fundamentals. It is a confluence score in the Library's sense, a weighted vote across independent factors, and it should be read with the disclaimer TipRanks prints on every page: the Smart Score's performance is based on backtested results, backtesting is developed with the benefit of hindsight, it allows the selection method to be adjusted until past returns are maximised, and the figures are gross of transaction costs and fees. None of that makes the score useless; it makes it a screening input rather than a return forecast, and any outperformance statistic quoted for it should be labelled as a backtest.
Plans and Prices
The plans page, read in a browser in September 2026, listed two paid tiers above the free Basic access, both shown with a 55 percent promotional discount and a 30-day money-back guarantee. Promotions change, so treat the list prices as the reference and the discounted figures as that day's offer.
| Tier | Price shown | What it adds |
|---|---|---|
| Premium | $30 per month list, $13.50 at the 55% discount | Advanced stock analysis tools including Smart Score, Bulls Say Bears Say, analyst forecasts, AI stock analysis, financials, ownership and technicals; advanced investment ideas and screeners; Smart Portfolio with up to three portfolios; follow up to five experts and 30 stocks; daily analyst ratings; PDF export; priority support |
| Ultimate | $50 per month list, $22.50 at the 55% discount | Everything in Premium at full access plus stock risk factor analysis, Insiders' Hot Stocks, research firm rankings, the complete expert rankings, unlimited follows and email alerts, up to six portfolios, full daily insider trading feed, PDF and CSV export and VIP support |
The tiers differ in depth rather than kind: Premium has the analysis tools and ideas at an advanced level, Ultimate unlocks the full expert rankings, the complete insider feed, CSV export and more portfolios. An investor who mainly wants the Smart Score, consensus and screeners is a Premium customer; one who wants to build their own datasets from the rankings and insider transactions needs the CSV export and the full rankings on Ultimate.
What TipRanks Is and Is Not
TipRanks is a research and screening layer for US-listed stocks and ETFs. It publishes what experts said and how those calls did, ranks the experts, aggregates the evidence into a consensus and a score, and offers screeners, calendars and a portfolio tracker on top; its FAQ is explicit that it does not tell you where to invest. It is not a charting platform, its ratings coverage is centred on US markets, and it holds no execution or backtesting of your own rules. Three reading habits follow from the method. Prefer the Top Analyst Consensus to the raw one, because the ranking is the platform's actual contribution. Weight informative insider buys and clusters over any single sale. And treat the Smart Score as a filter that narrows a universe, then do the work on what remains, which is where the next section begins.
Where Quant Charts Fits
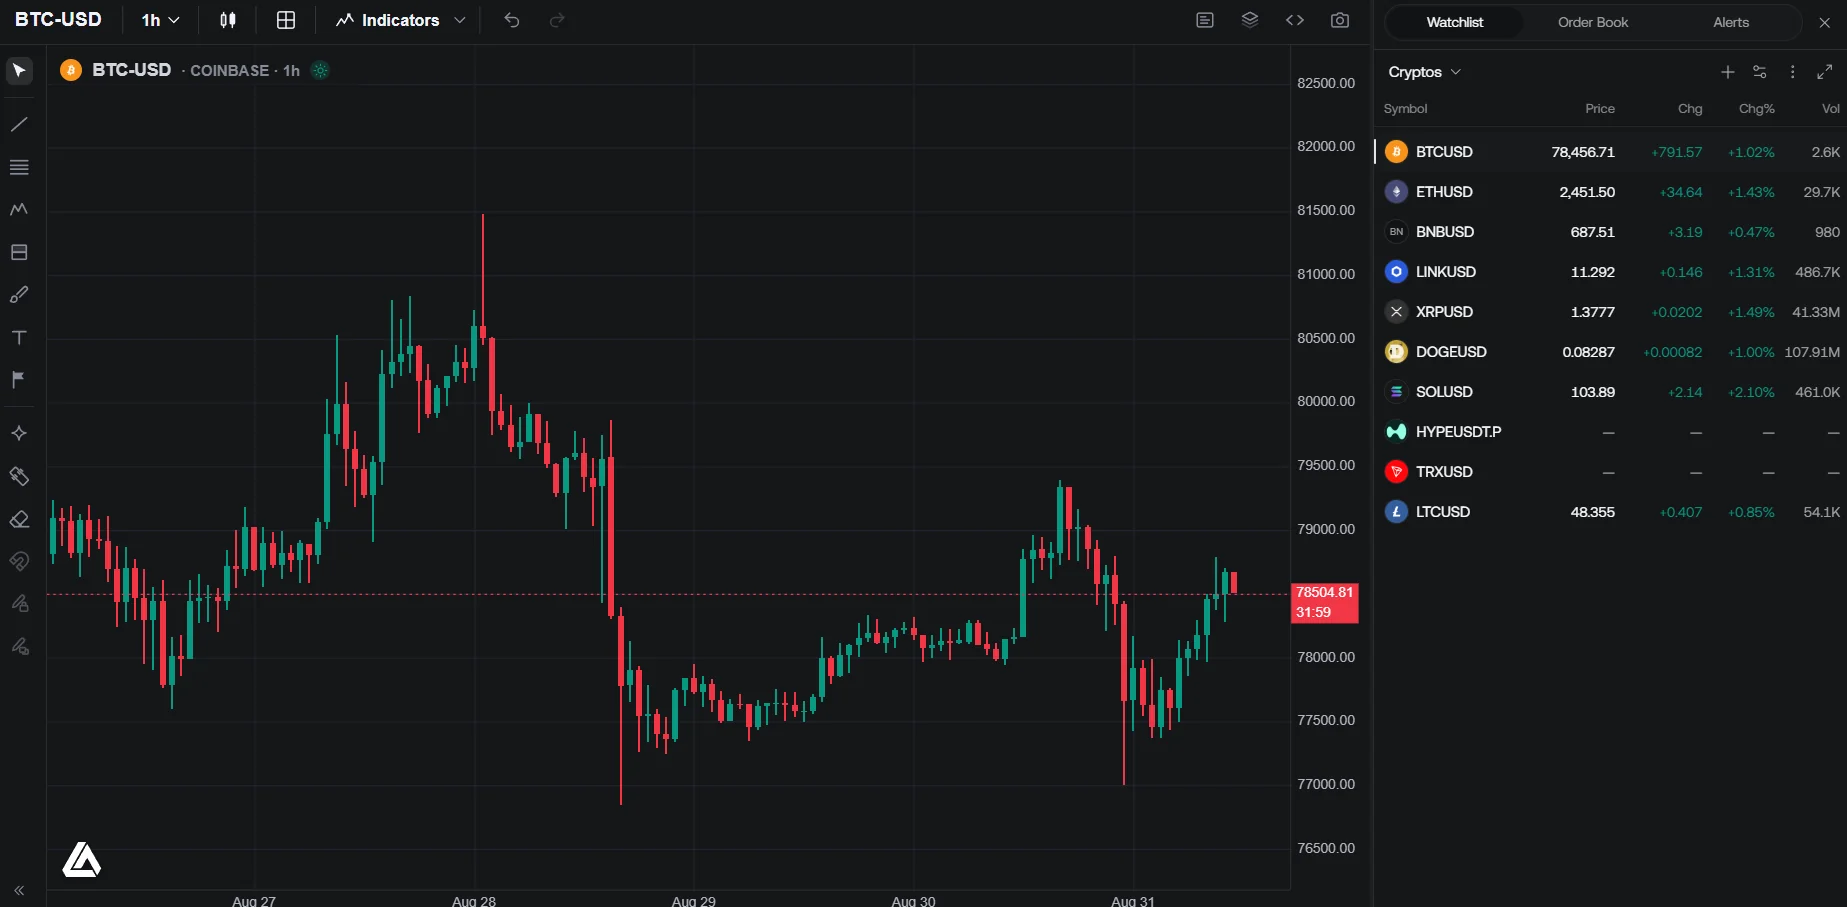
Quant Charts does not carry analyst ratings, insider filings or hedge-fund holdings, and this article will not pretend otherwise; TipRanks' datasets are its own. What Quant Charts holds is the study surface for the names TipRanks produces and the test for the technical side of an idea. A screener result, say the Top Smart Score stocks in one sector, goes into a Watchlist, where the Advanced view shows Price, Financials and News tabs for every symbol, with revenue, net income, earnings per share, price-to-earnings, dividend and beta alongside market cap, sector and 52-week range, grouping by sector or exchange, your own sections, and a headline feed filtered to the list. That is enough to check TipRanks' fundamentals and news inputs against a second source and to read the chart the score does not show.
The Library covers the reading side of expert and sentiment data. Besides the analyst and insider entries above, the alternative sentiment data entry separates attention from valence in news and social scores, a distinction that matters when a stock's blogger and investor sentiment is high because it is being argued about rather than because opinion is bullish, and the sentiment surveys entry explains why crowd readings are most useful at extremes. Library indicators such as Market Sentiment Technicals give the technical component of a composite view directly on the chart.
The test is the part TipRanks cannot run. A Smart Score or a consensus upgrade is not a rule you can backtest on Quant Charts, because the ratings data is not on the chart; the technical half of the idea is. If your reading of TipRanks is that upgraded names tend to break out, describe the technical condition to Quant in plain language, for example a close above the fifty-day average on volume above its twenty-day average, with a stop below the breakout bar and a two-R target. Quant writes the Pine Script as a strategy, you inspect it under Code and click Run on the symbols from your list, and the Backtest Summary reports net profit, trade count, win rate, maximum drawdown and profit factor across the chart's history, with commission and slippage set in the strategy Properties so the result is costed. Run it on the high-score names and on a control group of low-score names in the same sector: if the technical rule performs similarly on both, the score is not adding what you assumed; if it performs better on the high-score group, you have a reason to keep paying for the filter.
Where Each Tool Stops
TipRanks stops at research: expert track records, consensus, Smart Score, screeners, calendars and portfolio tracking for US-listed names, with no charting depth, no execution and, by its own statement, no investment advice. Quant Charts stops at the chart and the test: watchlists with financials and news, Library indicators and concepts, and Quant's strategies and Backtest Summary, with no analyst or insider datasets and no order routing, because the LuxAlgo platform does not place orders for you.
Conclusion
TipRanks' lasting contribution is accountability with a published method: a ranking that rewards analysts for positive returns on a statistically meaningful number of calls, a consensus whose arithmetic anyone can check, and a clear split between insider trades that mean something and those that do not. Its Smart Score is a reasonable confluence filter whose performance the company itself labels as backtested, and its two paid tiers are priced by how much of the underlying data you want to see and export. Used as a filter, it earns its place. The chart, the fundamentals check and the test of whether the names it surfaces actually behave the way you expect belong on Quant Charts, where the Watchlist holds the list, the Library explains the data, and Quant turns the technical half of the idea into a costed Backtest Summary.
Key Takeaways
- TipRanks ranks experts by success rate and average return since 2009, weighted for the number of ratings; Top Analysts are the top 20 to 30 percent.
- The consensus scores Buy 1, Hold 3, Sell 5 over three months into five bands; the Top Analyst Consensus is the more informative version.
- Informative insider trades count, uninformative ones do not; the Smart Score is a backtested confluence filter by the company's own disclaimer.
- Premium and Ultimate listed at $30 and $50 a month, shown at 55 percent off, differ in depth of rankings, insider feed, exports and portfolios.
- Quant Charts holds no ratings data; use its Watchlist for financials and news on TipRanks names and Quant's Backtest Summary to test the technical rule.
FAQs
What is TipRanks?
TipRanks is a stock research platform that tracks and scores the published calls of Wall Street analysts, financial bloggers, hedge funds and corporate insiders, with records since January 2009 and more than 96,000 experts measured. It offers consensus ratings, a 1 to 10 Smart Score, screeners, calendars and a portfolio tracker, and states that it does not tell users where to invest.
How does TipRanks rank analysts?
Its Star Ranking, developed with the Cornell Finance Department, combines each analyst's success rate and average return, with return weighted more heavily, and applies a Z test so records built on more ratings count for more. Buy ratings are measured for one year unless closed by a Hold; a Sell opens a short. Top Analysts are the top 20 to 30 percent.
How is the analyst consensus calculated?
Ratings from the last three months are scored Buy 1, Hold 3 and Sell 5 and averaged. Averages up to 1.5 are Strong Buy, up to 2.5 Moderate Buy, up to 3.5 Hold, up to 4.5 Moderate Sell and above that Strong Sell, with Strong labels requiring at least three ratings. Premium users can restrict the calculation to top-performing analysts.
Is the Smart Score's outperformance real?
TipRanks' own disclaimer states that Smart Score performance is based on backtested results, developed with hindsight, adjustable until past returns are maximised, and presented gross of transaction costs and fees. Treat the score as a screening filter and any outperformance figure as a backtest, not a track record.
How much does TipRanks cost?
In September 2026 the plans page listed Premium at $30 per month and Ultimate at $50 per month, both shown at a 55 percent promotional discount ($13.50 and $22.50), with a 30-day money-back guarantee. Ultimate adds the complete expert rankings, the full insider feed, unlimited alerts, CSV export and up to six portfolios.
Does Quant Charts have analyst ratings or insider data?
No. Quant Charts carries price and volume data, company financials and news in its Watchlist, Library indicators and concepts, and Quant's strategy backtests. Use TipRanks for expert and insider datasets, then bring the names to Quant Charts to read the chart, check the fundamentals and test the technical rule with the Backtest Summary.
References
LuxAlgo Resources
- Quant Charts
- Watchlist
- Watchlist Advanced view: Price, Financials, News
- Quant: making strategies and the Backtest Summary
- Library concept: analyst revision breadth
- Library concept: insider transactions
- Library concept: alternative sentiment data
- Library concept: sentiment surveys
- Library concept: confluence and scoring systems
- Library: Market Sentiment Technicals
External Resources
Read next