TraderSync: Trade Journal Breakdown
A trade journal is not one feature but a chain of them: capturing every fill, attaching context to each trade, computing the statistics that separate luck from skill, checking the trades against a written plan, and turning what the record shows into practice. TraderSync builds each link of that chain into a single web application, with broker sync, tagging, a large report set, an AI analyst called Cypher and a market replay simulator that logs practice trades back into the same analytics. This article breaks the journal down link by link, states what each TraderSync tier includes at the prices shown in September 2026, and then walks the same chain through the Journal on Quant Charts, LuxAlgo's charting and AI platform, where fills are logged from the chart, the Breakdown page slices P&L by weekday, hour, symbol and tag, and Quant, the coding agent, can turn a journaled setup into a backtested strategy.
Key points:
- Journals record fills, not trades. Both TraderSync and the Quant Charts Journal rebuild round trips from executions, which is why partial exits need a matching rule such as FIFO or weighted average.
- Tags are the analysis. A P&L number tells you nothing about why; consistent setup and mistake tags are what let a journal say which behaviours pay.
- The useful statistics are per trade, in R. Expectancy, R multiples and maximum adverse excursion compare trades across sizes and instruments; raw dollars do not.
- Prices and limits differ by tier. TraderSync's plans share the journal core and diverge on accounts, AI message quotas and replay precision.
Link One: Capturing the Fills
Everything downstream depends on a complete record of executions, and the first question to ask of any journal is how the fills get in. TraderSync's supported brokers page lists several hundred brokers, exchanges and platforms, from Interactive Brokers, Charles Schwab, E*TRADE and Fidelity to Binance, Coinbase, DAS Trader and Bookmap, with a filter for which support auto-sync and which need a file import; the pricing page rounds the total to more than seven hundred. Once fills are in, the platform states that profit and loss is calculated automatically per trade, commissions can be entered, imported or applied by rule, and partial exits are matched to entries by LIFO, FIFO or weighted average, with reports generated by close date, open date or transaction date.
The features page adds two capture details that matter for the later analysis. Targets and stop losses can be set by rule or by hand for each trade and are charted alongside the fills, so adherence can be measured rather than remembered; and option spreads are detected automatically, so a multi-leg position is journaled as one trade rather than four executions. One limitation is stated plainly: journaling supports any market, but the trade charting that plots your entries and exits on price is for US equities only.
Link Two: Attaching Context
A fill says what happened; context says why. TraderSync attaches four kinds. Notes per trade capture the reasoning at the time. Screenshots of the trading platform preserve what the screen looked like. Tags classify each trade by strategy, by mistake, by market condition or by emotion, and the analytics then report metrics around each tag. And the interactive chart of the trade, for US stocks, shows entries, exits, targets and stops on intraday price action so execution timing can be judged against the plan. A public profile and per-trade sharing let a mentor see the same record, with the option to hide the return or the notes.
The discipline that makes this link work is consistency of vocabulary. A tag set of half a dozen setups and half a dozen mistakes, applied to every trade, produces a report; a hundred ad hoc tags produce a word cloud. Decide the taxonomy before the first import and resist adding to it for a month.
Link Three: The Statistics
This is where TraderSync's report set is deepest, and where the Library's vocabulary helps in reading it. The analytics page lists an individual trade report, a calendar, an Evaluator that stacks strategies side by side, a What-If Simulator for alternative choices, a Rolling Exit Report on whether holding longer would have paid, an MFE/MAE report on how far each trade went in your favour and against you, a running P&L chart within each trade, a best-exit indicator, and advanced filtering with drill-down. The R multiple can be defined against a fixed risk amount, for example $500, so every trade's result is expressed as a multiple of intended risk.
| Report | Question it answers | How to read it |
|---|---|---|
| Individual trade report and running P&L | What happened inside this trade, tick by tick? | Compare where you exited with where the running P&L peaked; the gap is execution, not edge |
| Calendar | Which days paid and which bled? | Look for clusters, not single days; one bad Friday is noise, six is a rule |
| Evaluator | Which setup performs best under which conditions? | Rank by expectancy per trade, not total profit, so a rarely traded setup is judged fairly |
| MFE/MAE | How far did trades run for and against you before closing? | A stop consistently wider than the MAE of winners is capital left on the table; a stop tighter than it is stopping out good trades |
| Rolling Exit and best exit | Would a different exit rule have improved results? | Treat as a hypothesis to test forward, not proof; the best exit is only visible in hindsight |
| What-If Simulator | What if trades of a certain type had been skipped? | Useful for filters such as R-multiple or time of day; beware of removing the losers that made the winners possible |
Two Library entries frame the reading. Expectancy is the average result per trade across the whole distribution, win rate times average winner minus loss rate times average loser, and it is the only figure that says whether a process makes money before size is considered, which is why a high win rate with an occasional large loser can still be negative. The R-multiple framework expresses every outcome as a multiple of the risk taken at entry, which is what lets a journal compare a futures scalp with a swing trade in a stock: each is so many R, and expectancy becomes the average R per trade. Read every TraderSync report in those units first and in dollars second.
Link Four: The Plan and Its Enforcement
A journal that only reports is a diary. TraderSync's risk management features let you write rules such as a maximum loss per day or a maximum number of trades per session, define targets and stops per trade, and then report adherence, so the question shifts from what happened to whether you did what you said you would. The Strategy Checker holds the checklist for each setup, the Trade Planning tool holds the plan, and the tiers differ in how many of each you can keep. The Cypher AI layer is organised around the same idea: alongside performance summaries and pattern detection, it monitors trades against the plan, flags recurring behaviours that cost money, and reviews an individual trade against your plan, strategy history and risk profile using internal metrics such as R multiple, expectancy and target quality. The assistant answers a quota of questions per day that rises with the tier.
Link Five: Practice and Replay
The last link closes the loop. TraderSync's market replay simulator replays sessions with a workspace modelled on a trading terminal, with update precision that depends on the tier, Level II depth for US stocks, options and futures and a colour-coded tape on the top tier, and a watchlist, multi-chart view, key statistics, screeners, speed control and order management. Every practice trade is logged into the same analytics as live trades, so the journal's statistics can be built before capital is at risk. Playlists group past trades or setups for repeated drilling, and the shuffle and hide options conceal symbols and dates so that practice tests reading rather than memory, which is the single most important control in any replay tool.
Plans and Prices
The pricing page, read in a browser on 11 September 2026 with its default annual toggle showing a twenty-five percent saving, listed three tiers with a seven-day free trial on each; the monthly-billed prices are the figures the same page showed when the toggle was switched to monthly in an earlier check. Figures change with promotions, so treat these as the shape of the pricing rather than a quote.
| Tier | Annual billing | Monthly billing | What changes |
|---|---|---|---|
| Pro | $22.46 per month, $269.52 per year | $29.95 per month | 5 accounts, 3 strategies, 1 trading plan, 3 playlists, 5 assistant messages a day, market replay at one-minute precision for stocks, futures, crypto and forex |
| Premium | $37.46 per month, $449.52 per year | $49.95 per month | Unlimited accounts, strategies, plans and playlists, 15 assistant messages a day, one-second replay precision |
| Elite | $59.96 per month, $719.52 per year | $79.95 per month | 60 assistant messages a day, 250-millisecond replay precision, all assets including options in replay, Level II and Time and Sales, and the AI coaching the tier is described around |
The journal core, analytics, tagging, imports and mobile access are on every tier, so the decision is about how many accounts and plans you keep, how much you will use the assistant, and whether tick-level replay with the order book is part of your practice. A trader journaling one account against one plan loses little on Pro; a scalper rehearsing on tape and depth is the Elite customer.
The Same Chain on Quant Charts
The Journal on Quant Charts runs the same five links inside the charting platform, and it is included on every plan and lives on the account rather than in a workspace. Capture comes three ways, per the accounts page: connect a broker and fills sync daily, import a statement in CSV, TXT or HTML with the format detected automatically, with Interactive Brokers activity statements and Flex Queries, MetaTrader 4 and 5, thinkorswim and Schwab, TradingView paper trading, NinjaTrader, Tradovate, TopstepX, Webull, DAS Trader Pro and exports from TradeZella and Tradervue recognised, or start a manual account with an optional initial balance and a FIFO, LIFO or weighted-average matching rule for partial exits. You log fills, not trades, and the book is rebuilt from them; a second fill on the other side of a symbol closes or reduces the position.
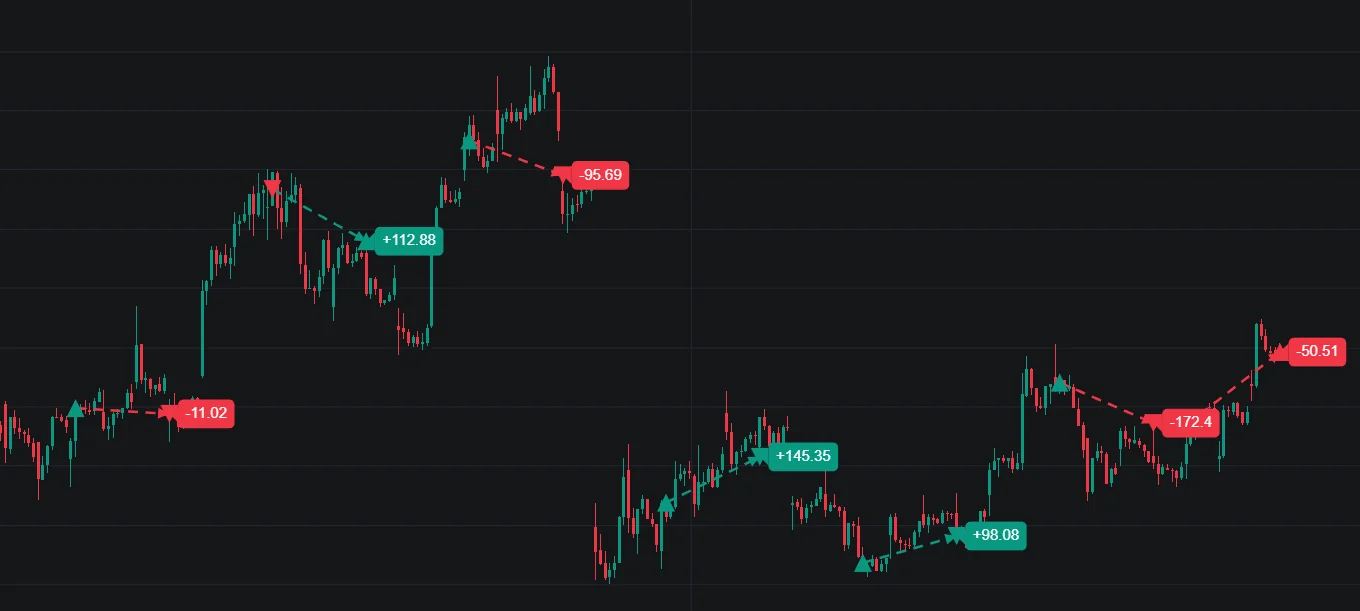
Context is attached on the chart and in notes. While the Journal is open, the drawing toolbar gains a Journal Trade tool that captures the clicked bar's time and price and opens the add-fill dialog prefilled with the symbol, so a discretionary fill is logged where it happened, and a sibling Journal Note tool appends to that day's note; day notes hold the plan, the context and the review, separate from per-trade notes and review fields. The dashboard then supplies the statistics: net P&L, win rate, profit factor, average win against average loss and day win rate as headline cards with deltas against the previous period, an equity curve, drawdown in currency or in percent of an initial balance, daily P&L, a calendar coloured by result, and a Risk and Behaviour strip with maximum drawdown, expectancy per trade, average duration, current streak and best and worst day. Expectancy in R needs a stop on each logged trade, the same requirement TraderSync's R multiple imposes, and the Edge Score, a composite of six repeatability dimensions that appears after five closed trades, is documented as a repeatability read rather than a guarantee.
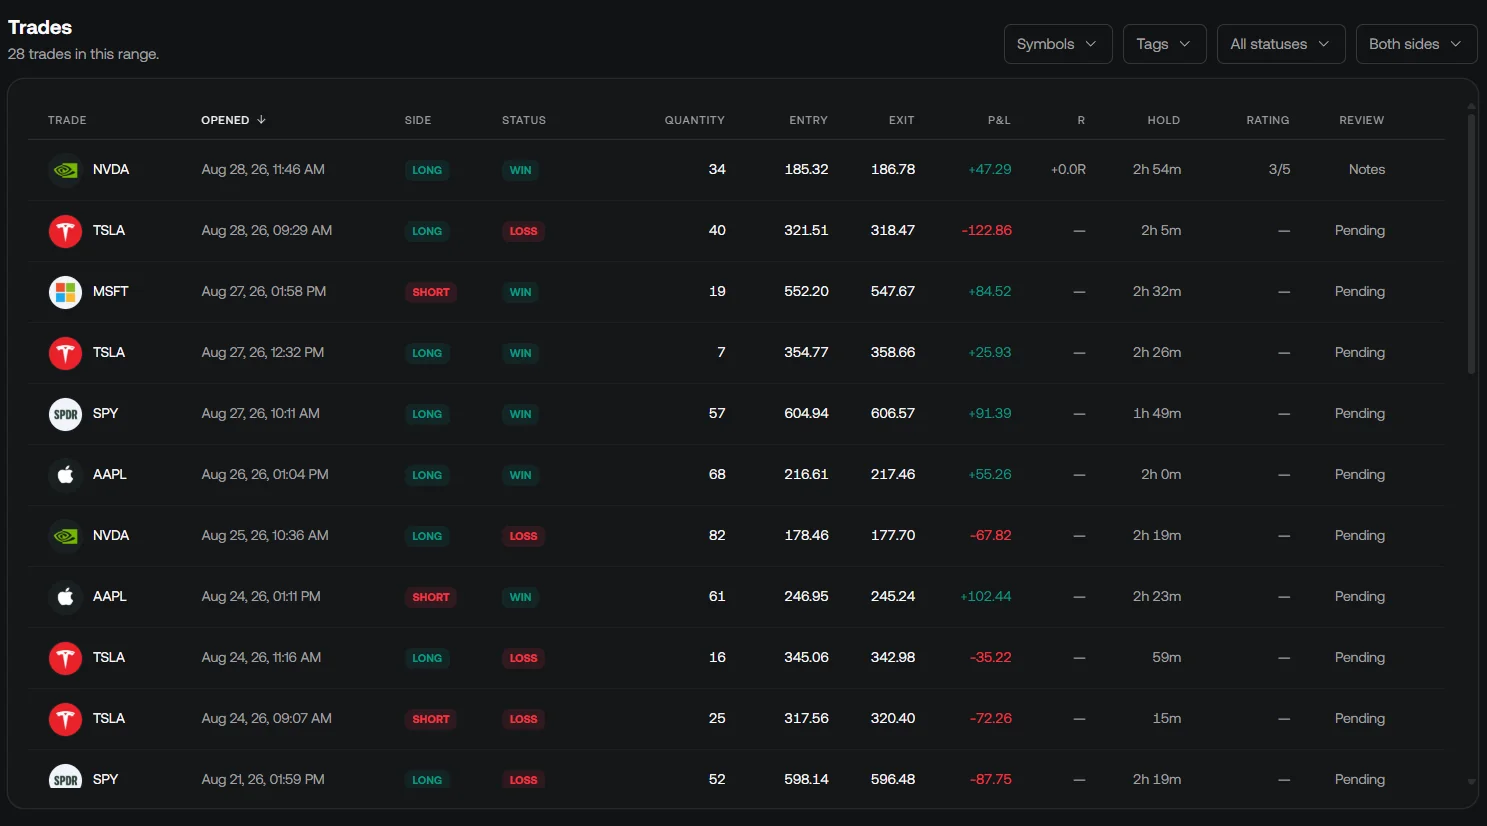
The Breakdown page is the Evaluator's counterpart. It slices the selected account's P&L by day of week, time of day by entry hour, hold-time bucket, symbol ranked by impact, long against short, and position-size quartile, and its Tag and Rating slices use the review fields saved on each trade, so tagging setups consistently, breakout, fade, whatever your names are, shows which labels actually make money. When a slice has at least three trades the page writes a short read at the top, a weekday that consistently loses or shorts that bleed while longs earn, which is the pattern-detection job done from the same table. What the Quant Charts Journal does not have is a replay simulator or a conversational assistant over the journal; what it has instead is the chart underneath and Quant beside it.
That last difference is the one that closes the loop differently. A journal can show that a tagged setup has positive expectancy over forty trades; it cannot show whether the setup had an edge over five years, because it only knows the trades you took. On Quant Charts you describe the setup to Quant in plain language as an entry, a stop and an exit, Quant writes the Pine Script as a strategy, you inspect it under Code and click Run, and the Backtest Summary reports net profit, trade count, win rate, maximum drawdown and profit factor across the chart's history, with commission and slippage set in the strategy Properties so the result is costed. If the journal says a setup pays and the backtest agrees, you have two independent readings; if they disagree, the difference is usually execution, and the journal's per-trade review is where to look. The LuxAlgo platform does not place orders for you; the Journal records what a broker did, it does not instruct one.
Where Each Tool Stops
TraderSync stops at the record and its analysis: it imports and syncs fills from hundreds of platforms, reports on them, enforces a written plan, answers questions about the data through its AI assistant and offers replay practice, but it holds no live chart of your own indicators and no strategy backtester across market history. The Quant Charts Journal stops at the record on the chart: fills, notes, tags, dashboard and breakdown beside the price action they happened on, with Quant's Backtest Summary for the rule behind the setup, and no replay, no assistant over the journal and no order routing.
Conclusion
Broken into its links, a trade journal is a capture problem, a labelling problem, a statistics problem, a discipline problem and a practice problem, and TraderSync has built a purpose-made tool for each: wide broker coverage and rule-based commissions, tags and screenshots, a report set that runs from calendars to MFE/MAE, plan rules with adherence tracking and an AI that reviews trades against them, and a replay simulator that feeds practice back into the record. Its tiers price the depth of that stack. The Quant Charts Journal runs the same chain beside the chart, with fills logged where they happened, a Breakdown page that slices P&L by weekday, hour, symbol and tag, and the one thing a journal alone cannot provide: Quant writing the journaled setup as a strategy so the Backtest Summary can say whether it ever had an edge. Whichever you use, the rules are the same. Log every fill, tag with a fixed vocabulary, read results in R, and let the record, not the memory of it, decide what you trade next.
Key Takeaways
- Journals rebuild trades from fills; choose the partial-exit matching rule deliberately.
- A fixed tag vocabulary is what turns a P&L list into a report on which setups and mistakes pay.
- Read expectancy and R multiples before dollars; MFE/MAE shows whether stops and targets fit the trades you actually take.
- TraderSync tiers share the journal core and differ on accounts, assistant quotas and replay precision.
- The Quant Charts Journal logs fills from the chart, slices P&L in Breakdown, and pairs with Quant's Backtest Summary to test the setup's edge.
FAQs
What is TraderSync?
TraderSync is a web-based trading journal that imports or syncs fills from several hundred brokers and platforms, tags and charts each trade, produces performance reports such as calendars, Evaluator comparisons and MFE/MAE, enforces written trading plans, answers questions through its AI assistant, and includes a market replay simulator whose practice trades log into the same analytics.
How much does TraderSync cost?
In September 2026 the pricing page showed Pro, Premium and Elite at $22.46, $37.46 and $59.96 per month on annual billing ($269.52, $449.52 and $719.52 a year), and $29.95, $49.95 and $79.95 when billed monthly, each with a seven-day free trial. Tiers differ on account limits, assistant message quotas and replay precision.
Why do journals record fills rather than trades?
A trade is several executions: an entry, perhaps partial exits, a final exit. Recording each fill lets the journal rebuild the round trip and match partial exits to entries by FIFO, LIFO or weighted average. Both TraderSync and the Quant Charts Journal work this way.
Which journal statistics matter most?
Expectancy per trade, preferably in R, tells you whether the process makes money before size; win rate and average win against average loss decompose it; maximum drawdown shows the cost of getting there; and MFE/MAE shows whether stops and targets fit the trades you take. Total profit alone hides all of these.
What does the Quant Charts Journal include?
Broker sync, statement import for common brokers and journals, and manual accounts; fills logged from the chart with entry and exit markers; day and trade notes; a dashboard with net P&L, win rate, profit factor, expectancy, drawdown and an Edge Score after five closed trades; and a Breakdown page slicing P&L by weekday, hour, hold time, symbol, side, size, tag and rating. It is included on every plan.
Can a journal prove a setup has an edge?
Only for the trades you took. To test the rule itself across history, describe the setup to Quant on Quant Charts, inspect the Pine Script under Code, click Run, and read the Backtest Summary with commission and slippage set in Properties. Agreement between the journal and the backtest is two independent readings; disagreement usually points to execution.
References
LuxAlgo Resources
- Quant Charts
- Journal overview
- Journal accounts: broker sync, imports, manual books
- Journal trades: fills, chart markers, review
- Journal dashboard and Edge Score
- Journal breakdown
- Journal notes
- Quant: making strategies and the Backtest Summary
- Library concept: expectancy
- Library concept: R-multiple framework
- Library concept: drawdown statistics
- Library concept: win rate
External Resources
Read next