UnusualWhales Scanner — Sweeps Flow and Edge
Unusual Whales is an options-flow platform: it shows every options trade printed across the US exchanges in real time, flags the ones that look unusual, and lets you filter the tape by premium, size against open interest, side of the market and a dozen other conditions. It is run by a small team with no outside funding, it publishes the Congressional trading reports that made its name, and it sits on top of the feed with gamma exposure, dark-pool prints, a market-wide tide reading and an AI assistant. This article explains what the flow feed actually shows and how a sweep differs from a block or a split order, how to read flow without inventing conviction that is not there, what the retail plans cost in September 2026, and where Quant Charts, LuxAlgo's charting and AI platform, fits: it carries no options-flow feed, but its order-flow tools read the underlying's tape, its Library explains open interest, put/call ratios and block prints, and Quant, the coding agent, can backtest the technical follow-through of a flow alert while the Journal tests whether flow-tagged trades actually pay.
Key points:
- Flow is a tape, not a signal. Unusual Whales shows what traded and lets you filter it; every print has a buyer and a seller, and the platform's own footer says it is not financial advice.
- The useful filters are relational. Premium size, volume or size greater than open interest, opening trades, out-of-the-money strikes and ask-side fills are what separate positioning from noise.
- Prices are plan-tiered. Retail Basic, Pro and Max were listed at $50, $75 and $120 a month, with annual discounts, and free accounts see limited, delayed data.
- Test the follow-through elsewhere. Quant Charts cannot see the options tape, but it can backtest the price rule you attach to an alert and journal the results by tag.
What Unusual Whales Is
The about page describes a small team with zero outside funding whose work splits two ways: market data for retail traders, and public-interest reporting on Congressional trading and lobbying. Its 2021 report on Congressional trading drew national coverage and, by the company's account, was followed within six days by six new bills; later reports have been cited by ABC News, Bloomberg and Reuters. The data side pulls options flow, dark-pool prints, analyst price targets and news into one dashboard, with a Discord community the company says numbers around 100,000 traders and coverage of more than 11,000 tickers. Mr. Whale, an AI companion added to the platform, answers questions about a ticker, sets alerts from chat and can send a daily brief. The pricing page carries the disclaimers that belong next to any flow tool: results may vary, trading involves risk, and none of it is financial advice.
What the Flow Feed Shows
The core product is the options tape. The pricing page describes the feed as the full tape with 100 percent market coverage, real-time trade data for every options trade across all US exchanges, with unusual-activity indicators and custom alerts on top, and free accounts limited to a partial feed on a fifteen-minute delay. The API documentation is the clearest statement of what a filter can actually test, because the same fields drive the website's filters. A trade carries a premium, a size, days to expiry, the contract's volume and open interest, whether the strike is out of the money, whether the trade opened a position, whether its size or the day's volume exceeds open interest, whether it filled at the ask or the bid, and whether it was one leg of a multi-leg order. The unusual-activity alerts and the options screener add a minimum premium and a volume-to-open-interest ratio, and the platform's proprietary Market Tide and net premium series aggregate call and put premium across the market.
Three words get used loosely around flow and are worth fixing. A sweep is an order routed across several exchanges at once to take all the liquidity available at or near the current price, which is why it prints as a burst of fills within seconds; it signals urgency, not identity. A block is a single large print, often negotiated off the public book and reported afterwards, the options equivalent of the equity blocks the Library's block trades entry describes, with the same limitation that a print has both a buyer and a seller. A split is a large order worked in pieces over time, which is what a filter for repeated prints in the same contract is trying to catch. Unusual Whales tags trades with these attributes so that a filter can ask for, say, ask-side, opening, out-of-the-money calls with premium above a threshold and size greater than open interest, which is a far more specific question than "big trade".
| Filter | What it tests | Why it matters |
|---|---|---|
| Minimum premium | Dollars committed to the trade | Removes small retail prints; the threshold is a choice, not a rule |
| Size or volume greater than open interest | More contracts traded than existed at the open | New positioning rather than hands changing on existing contracts |
| Opening flag | Whether the trade added to a position | Separates initiation from closing and rolling |
| Ask-side or bid-side | Where in the spread the fill printed | Ask-side buying is the aggressive side; bid-side fills may be sales or hedges |
| Out of the money, days to expiry | Strike and horizon | Short-dated OTM buying is speculative; long-dated is a different animal |
| Multi-leg exclusion | Whether the print is one leg of a spread | A leg read alone can invert the trade's actual direction |
Reading Flow Without Fooling Yourself
The discipline is to remember what a print cannot tell you. It cannot say who traded, whether the buyer is a speculator or a fund hedging stock, or whether a call purchase is a bet or the cheap leg of a collar. It cannot say the trade will be held; many large prints are closed the same day. And a filter that shows only what confirms a view will always find something, because the tape is enormous. Three Library concepts supply the context that keeps flow honest. The open interest entry explains why the volume-to-open-interest relationship matters: open interest counts standing positions, volume counts turnover, so volume above open interest means new positions had to be created, and the next day's change in open interest confirms whether they stayed. The put/call ratio entry gives the aggregate sentiment read, with its contrarian logic and the reason the equity-only ratio is preferred to the index ratio, which is dominated by institutional hedging. And the implied volatility entry explains why premium alone is a poor measure of conviction: the same dollar premium buys very different exposure at an IV rank of 10 and an IV rank of 90, and a flow reader who ignores IV will overweight prints made when options are simply expensive.
Beyond the Tape
The flow feed is the anchor, but the plans list a wider set. Market maker exposure for SPX updates every ten minutes on the Basic and Pro tiers and every minute on Max, alongside a gamma exposure heatmap for all US tickers; the API exposes both static and spot gamma exposure by strike and interpolated implied volatility with percentiles. Daily options and dark-pool data can be downloaded, politician trade information is included, and prediction-market data is offered as a way to watch for informed activity in a different venue. Greeks and volatility dashboards, an options profit calculator, institutional holder and insider data, a stock and options screener, saved filters, custom dashboards and alerts on the web and mobile app round out the tool set, with the number of alerts, watchlists and dashboards the main difference between tiers.
Plans and Prices
The retail Dashboard & Tools plans listed in September 2026 are below. Annual billing is discounted, free accounts get limited flow on a fifteen-minute delay, API plans are data-only with a one-week free trial, and a Whale Bundle combines Retail Max, the API and the Predictions product at roughly 30 percent less than the parts. Subscriptions auto-renew and can be cancelled from the account page; the pricing FAQ says a wrong-product purchase can be switched within seven days.
| Plan | Monthly | Annual | What changes |
|---|---|---|---|
| Free | $0 | $0 | Limited flow and options data, 15-minute delay, Discord access |
| Retail Basic | $50 | $42 a month, $504 a year | Real-time full tape, alerts and screener; 25 custom alerts, 5 watchlists, 5 dashboards, 10 saved filters per feed; SPX exposure at 10-minute updates |
| Retail Pro | $75 | $63 a month, $756 a year | Everything in Basic with unlimited alerts, watchlists, dashboards and saved filters; twice the Mr. Whale usage |
| Retail Max | $120 | $102 a month, $1,224 a year | Everything in Pro plus 1-minute SPX market maker exposure and three times the Mr. Whale usage |
Where Quant Charts Fits
Quant Charts has no options-flow feed, no dark-pool prints and no gamma exposure surface; those are Unusual Whales' data, and this article will not blur the line. What Quant Charts holds is the underlying's own order flow and the means to test what you do with an alert. Its order-flow tools are built from pre-aggregated footprints of real trades, one-minute slices of volume at price and per-side trade counts re-bucketed to any timeframe, for crypto and US equities. The Volume Delta indicator and its cumulative form show whether aggressive buyers or sellers are in control of the stock itself, the Footprint chart type shows where the volume printed inside each bar with imbalances and unfinished auctions, Bar Stats lists volume, delta and trade counts per candle, and Volume Bubbles mark size at price. The docs are explicit that there is no live order book or trade tape, and that footprint history depends on plan, one day on Free up to full history on Ultra.
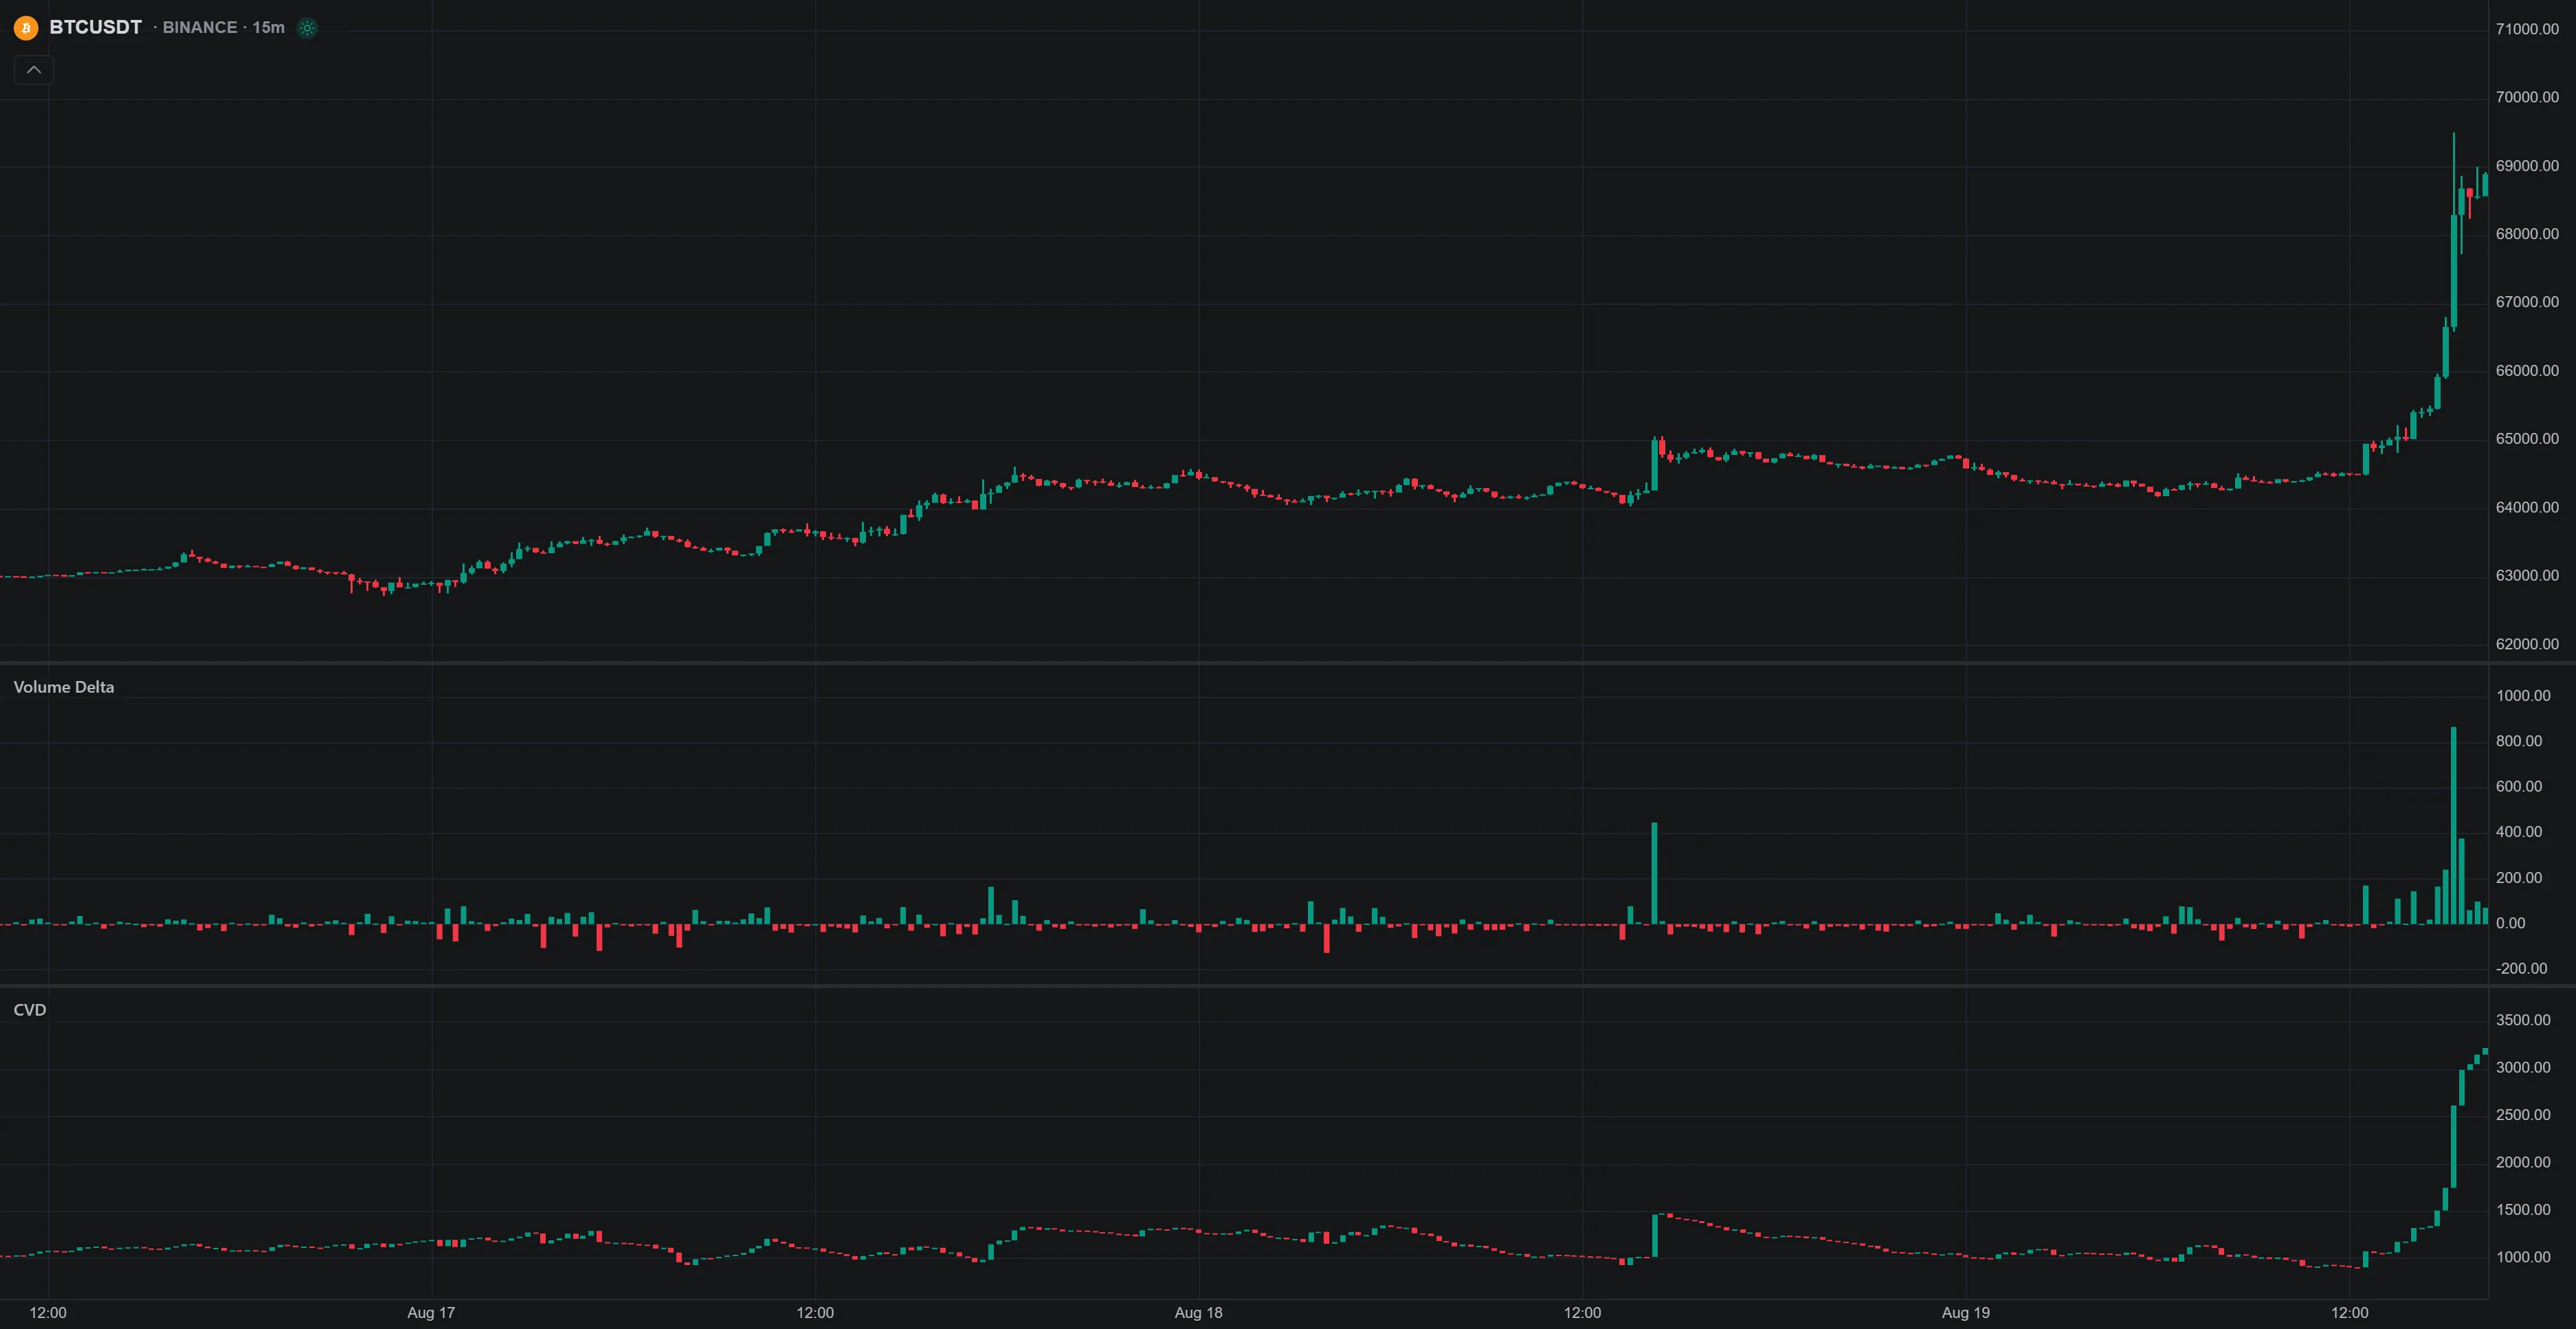
That gives a flow alert a second opinion. An ask-side call sweep in a stock whose cumulative volume delta is making new highs with price is telling a consistent story; the same sweep into a stock whose delta is falling while price holds is a print with a passive seller on the other side, and the Library's entry on reading CVD against price explains why that disagreement matters. The Library also carries indicators for the aggregate options reads, a Put/Call Ratio study and an Implied Volatility study with rank and percentile, so the sentiment and volatility context sits on the same chart as the price.
The test is where Quant Charts earns its place. The options print itself cannot be backtested there, because it is not on the chart, but the price rule you attach to it can. Describe it to Quant in plain language, for example enter long on a break above the high of the bar where the alert arrived if cumulative volume delta is above its twenty-bar average, stop below that bar's low, exit at two times risk or after ten bars. Quant writes the Pine Script as a strategy, you inspect it under Code and click Run, and the Backtest Summary reports net profit, trade count, win rate, maximum drawdown and profit factor across the chart's history, with commission and slippage set in the strategy Properties. Then close the loop in the Journal: tag each live trade you took from a flow alert, and the Breakdown page slices your P&L by tag, so after a quarter you know whether flow-tagged trades outperform the rest of your book, which is the only test of a flow subscription that counts.
Where Each Tool Stops
Unusual Whales stops at the options tape and the data around it: every print, the attributes that let you filter it, gamma exposure, dark-pool prints, market tide, politician trades and an AI assistant, with no claim to tell you who traded or why, and a footer that says it is not advice. Quant Charts stops at the underlying: order flow from real trades in the stock or coin, Library studies for open interest, put/call ratio and implied volatility, Quant's strategies with the Backtest Summary, and a Journal that scores trades by tag, with no options-flow feed of its own. The LuxAlgo platform does not place orders for you; it is a charting platform.
Conclusion
The value of Unusual Whales is the completeness of the tape and the precision of the filters: you can ask whether a print was opening, out of the money, ask-side, bigger than open interest and not a spread leg, which is a real question, and you can watch the market's aggregate premium and gamma alongside it. Its limit is the limit of all flow: a print is two parties and no motive, and a filter will always find something. Read it with open interest, the put/call ratio and implied volatility in view, confirm it against the underlying's own order flow on Quant Charts, backtest the price rule you attach to it with Quant, and let the Journal's tag breakdown decide whether the subscription is earning its keep.
Key Takeaways
- Unusual Whales shows the full US options tape in real time with filters for premium, size versus open interest, opening trades, moneyness, fill side and multi-leg orders.
- A sweep signals urgency, a block signals size, and neither identifies the trader or the motive; exclude spread legs and check the next day's open interest.
- Retail plans listed at $50, $75 and $120 a month in September 2026, with annual discounts; free accounts are limited and delayed 15 minutes.
- Quant Charts has no options flow but reads the underlying's order flow, and its Library covers open interest, put/call ratio, implied volatility and block trades.
- Backtest the price rule attached to an alert with Quant's Backtest Summary and tag flow trades in the Journal so Breakdown can show whether they pay.
FAQs
What is Unusual Whales?
Unusual Whales is an options-flow and market-data platform run by a small, self-funded team. It shows every US options trade in real time with unusual-activity flags and filters, plus gamma exposure, dark-pool prints, Market Tide, politician trades and an AI assistant called Mr. Whale, and it publishes reports on Congressional trading. It states that it does not provide financial advice.
What is an options sweep?
A sweep is an order routed across several exchanges at once to take the available liquidity at or near the current price, printing as a burst of fills within seconds. It signals urgency, not identity: the print does not reveal who traded or whether it was a bet, a hedge or one leg of a spread. Compare it with a block, a single large negotiated print, and a split order worked over time.
Which flow filters matter most?
Relational ones: size or volume greater than open interest, the opening flag, ask-side versus bid-side fills, out-of-the-money strikes with days to expiry, a minimum premium and exclusion of multi-leg orders. These are the fields exposed in the Unusual Whales API and used by its alerts and screener, and together they separate new directional positioning from turnover, hedging and spread legs.
How much does Unusual Whales cost?
In September 2026 the retail Dashboard and Tools plans were Retail Basic at $50 a month or $504 a year, Retail Pro at $75 or $756, and Retail Max at $120 or $1,224, which adds one-minute SPX market maker exposure. Free accounts get limited flow on a fifteen-minute delay, and API plans are sold separately with a one-week free trial.
Does Quant Charts show options flow?
No. Quant Charts has no options-flow feed, dark-pool prints or gamma exposure data. It reads the underlying's order flow from real trades, with Footprint, Volume Delta, Bar Stats and Volume Bubbles for crypto and US equities, and its Library covers open interest, put/call ratio, implied volatility and block trades as concepts and indicators.
How can I test whether flow alerts help my trading?
Attach a price rule to the alert and describe it to Quant on Quant Charts; it writes a Pine Script strategy, and after you inspect the code and click Run the Backtest Summary shows net profit, trade count, win rate, max drawdown and profit factor with costs. Then tag live flow-driven trades in the Journal and use Breakdown to compare their P&L with the rest of your trades.
References
LuxAlgo Resources
- Quant Charts
- Order Flow on Quant Charts
- Volume Delta and cumulative volume delta
- Quant: making strategies and the Backtest Summary
- Journal
- Journal Breakdown by tag
- Library concept: open interest
- Library concept: put/call ratio
- Library concept: implied volatility
- Library concept: block trades
- Library concept: cumulative volume delta
- Library: Open Interest Inflows & Outflows
- Library: Put/Call Ratio
- Library: Implied Volatility
External Resources
Read next